
If carbon dioxide emissions are to fall by 50% by 2030, i.e. to 20 Gt, then what might that look like? In just a decade the global energy system would need to look very different.

David Hone – Chief Climate Change Advisor for Shell
If carbon dioxide emissions are to fall by 50% by 2030, i.e. to 20 Gt, then what might that look like? In just a decade the global energy system would need to look very different.

In recent months we have all had to learn quickly about exponential rates of change as COVID-19 spread throughout the world, but as has been seen with the virus itself, exponential patterns typically stop and some other pattern of change emerges. Some mechanism intervenes in the process, typically starving the exponential process of its means for reproduction.
With the urgency around rising levels of carbon dioxide in the atmosphere, there is a desire by many to see renewable energy grow exponentially and quickly back out fossil fuels. Four years ago Fortune magazine reported that American futurist Ray Kurzweil forecast the dominance of solar PV in a little over a decade. Fortune noted the following;
Kurzweil’s basic point, reported by Solar Power World, was that while solar is still tiny, it has begun to reliably double its market share every 2 years — today’s 2% share is up from 0.5% in 2012. Many analysts extend growth linearly from that sort of pattern, concluding we’ll see 0.5% annual growth in solar in the future, reaching 12% solar share in 20 years. But linear analysis ignores what Kurzweil calls the law of accelerating returns — that as new technologies get smaller and cheaper, their growth becomes exponential. So instead of looking at year over year growth in percentage terms, Kurzweil says we should look at the rate of growth — the fact that solar market share is doubling every 2 years. If the current 2% share doubles every two years, solar should have a 100% share of the market in 12 years.
There is no doubt that solar PV has been doubling on a near two year basis. In 2015 global deployment was 230 GW installed capacity and this year it should be approaching 800 GW, which isn’t quite doubling every two years, but is close. But can this rate of change persist? It would imply 10 TW installed capacity by 2030 and 120 TW by 2040, from which enough energy could be generated to about meet all global requirements (~900 EJ in 2040), assuming it could be stored and channeled to the necessary services at the right time and place.
A related issue emerged on Twitter recently when well-known climate and energy expert Glen Peters (@Peters_Glen) took issue with a paper written by two colleagues in the Shell scenario team and published in Nature over a decade ago. In a twelve-tweet discussion Glen challenged the findings;
Will energy technologies grow exponentially until they reach “materiality” & then have linear growth? A common perception, but what does history say? Short answer: Old technologies are growing exponentially (not nuclear), just slower due to crowding out effects! . . . . . The ability for renewables to *displace* fossil fuels (not add to existing supply) will dictate whether renewables can grow exponential beyond “materiality”. If fossil fuels are taken out of the energy system, there is more space for renewables to grow exponentially. There is probably no physical reason why we can’t have 100% renewables, just like we once had 100% bioenergy, 50%-50% bioenergy-coal, etc The only limit is the one in our heads . . . .
There are a number of points here, but the question of exponential growth keeps returning. This isn’t about the level in the energy mix that renewables finally reach, but about the time it might take to get there. Exponential growth, such as that proposed by Ray Kurzweil, ought to be able to deliver a 100% renewable energy system by 2040.
The original paper that Glen Peters refers to was written by Martin Haigh and Gert Jan Kramer, so I took the question to Martin for further discussion. He noted that much of the background work to their Nature paper concerned the supply industry constraints related to production of materials required for deployment, but they had only limited space in their article to go into the necessary detail with graphs and charts.
So in practice, ongoing exponential deployment of solar is unlikely to happen because of stranded solar PV production facilities. Let me explain using two simple scenarios. In both cases the goal is to supply global energy demand with solar PV (putting aside the technical issues related to actually doing this) and global demand is rising from the current level of about 600 EJ by 1% per annum. The basic model I have developed also assumes that a field installation lasts for 35 years and that newer cells have improved efficiency over older models.
In an exponential scenario, solar PV rises at the rate described above, but this must be supported by investment in manufacturing facilities. By the time global demand is met in 2040, the world would have PV manufacturing capacity of 18,000 GW per annum, doubling from 9000 GW per annum just three years earlier. Even building the production facilities at this rate is questionable. But most of this capacity would then become stranded assets as demand for new solar PV would collapse. There would be residual demand for the newest most efficient modules replacing older modules, but this wouldn’t keep the industry going. In reality, this scenario wouldn’t happen as investors would see the coming over capacity problem and back away, therefore starving the exponential process of its means of reproduction.
In an investment scenario, solar PV rises exponentially in the early years, but then starts to shift away from the exponential case as investment in PV cell manufacture tapers. The result is a much slower rise towards meeting demand, but the investors in manufacturing don’t end up with stranded assets. In this example, manufacturing levels out at around 3000 GW per annum, one sixth of the above. Once solar PV generation meets global demand, the industry remains roughly balanced as it caters for both growth in energy demand and replacement of older installation. For much of the deployment period, growth is linear, not exponential.

Charts shown are for illustration purpose only
In the latter part of the century, some additional cell manufacturing capacity would be warranted, rising to around 4000 GW per annum due to the increasing replacement requirement. This would close the energy supply gap that is starting to appear after 2080.
But the outcome of the investment scenario is a 30 year delay in meeting the goal of 100% of global energy demand supplied by solar PV. This then challenges the other goal behind the requirement for very rapid deployment of new energy infrastructure; the need to limit warming to 1.5°C.

As the EU works to reset its emission reduction goals to align more closely with the 1.5°C goal of the Paris Agreement, a question arises around the scale and scope of the energy transition required. What will it look like? How fast should it proceed? Which technologies need to be accelerated to achieve the desired outcome? To help answer these and provide a perspective on the transition, my colleagues in the Shell Scenario team have produced a scenario sketch of the journey forward, arriving in 2050 with a net-zero emissions energy system (NB: The pathway was formulated in late 2019 prior to the COVID-19 pandemic and therefore does not include the energy system disruption being seen in 2020).
From a policy perspective, the EU has been addressing the climate issue for at least 15 years, with the EU Emissions Trading System in place since 2005. The 2020 energy situation arises from the 2007 climate and energy package, which included three key targets:
The targets were set by EU leaders in 2007 and enacted in legislation in 2009. They are also headline targets of the Europe 2020 strategy for smart, sustainable and inclusive growth. Within this, the EU Emissions Trading System is the EU’s key tool for cutting greenhouse gas emissions from large-scale facilities in the power and industry sectors, as well as the aviation sector. The ETS covers around 45% of the EU’s greenhouse gas emissions. In 2020, the target is for the emissions from these sectors to be 21% lower than in 2005.
The year 2020 represents a halfway point from 1990 to 2050, during which 20% of the hard deployment work has been done, but with a number of key technologies available at scale that hardly existed or didn’t exist around the turn of the century. Solar PV and Electric Vehicles are two examples (although solar PV did exist in 2000, it was expensive and small scale). That leaves just 30 years for the remaining 80% reduction, which must also include bringing to scale several other technologies which are yet to be deployed in the EU. This is a tall order and the scenario sketch illustrates how extraordinarily stretching it will be.
The additional key technologies that must move quickly to scaled deployment are as follows;
On the assumption that development and demonstration of all the above proceeds rapidly, deployment kicks in for most during the 2030s. But in the 2020s the energy technologies that have been nurtured over the last twenty years must be accelerated. For example, by 2030 solar must be quadruple current deployment, wind nearly triple current deployment and nuclear must be growing again, not declining.
In the 2030s the really hard work starts, with carbon capture and storage moving from first demonstration in the EU by 2025 to 40 medium sized facilities (one million tonnes CO2 stored per annum) by 2030 and over 100 by 2035. New technologies such as hydrogen fuel cell trucks must become ubiquitous during the 2030s, with at least 600,000 vehicles on the road by the end of that decade.


All of the above will require both technology development incentives and deployment policies. The analysis assumes a rising carbon pricing mechanism – whether explicit or implicit – to more than €200 per tonne of CO2 equivalent by 2050 to deliver and sustain the emission cuts and CO2 management necessary for the EU to reach climate neutrality. But even the EU ETS will need to change, as I discussed in a recent post.
While carbon pricing is an efficient lever for reallocating resources and driving behavioural change, it will not be enough on its own. A sectoral approach to policy which brings clean technologies, fuels and products to market, as well as their deployment and diffusion at scale, must urgently be developed. It is essential that policy should help provide consumers and businesses with low-carbon alternatives to adopt.
In the sketch, 2050 marks a point of climate neutrality for Europe, helped by the development of large scale carbon sinks through reforestation. But this isn’t the end of the transition, merely a point of significance. The hydrogen economy will continue to grow, electrification of industry will expand and efficiency gains will continue to be made. As was illustrated in the Sky Scenario, Europe will likely shift to become a net-negative emission economy during the second half of the century, a necessary requirement to ensure global net zero emissions and a 1.5°C limit on warming.
Download the EU Sketch here.

The recent 50th anniversary of the first moon landing brought with it many calls for an “Apollo Project” approach to address climate change. Such an approach is never defined in detail by those calling for it, but it presumably means marshaling government funds, establishing more energy research organisations and focusing all efforts on getting a handful of key energy technologies up and running in a short space of time.
There is no doubt that the Apollo programme was an amazing technical and engineering achievement, but is it the right recipe for success for dealing with the climate issue?
Behind the Apollo programme and the broader NASA effort in the 1960s was an immense research effort, which included a great deal of energy system research. After all, space flight is a voracious consumer of energy but storing energy and carrying energy for the journey is challenging. The 1960s saw significant NASA backed research into a technology that we now pin great hopes on for the 21st century, solar PV. In both the USA and USSR solar was fitted to various space vehicles, starting with the Telstar communication satellite in 1962 and Soyuz 1 in 1967. The first orbiting space station, Skylab, was powered by solar PV in 1973.

Skylab (Source: NASA)
As the 1970s unfolded and oil price shocks hit the global energy system, interest in solar PV picked up. In 1977 the U.S. Department of Energy launched the Solar Energy Research Institute, which later becomes known as the National Renewable Energy Laboratory (NREL). By 1980 ARCO Solar became the first panel manufacturer to hit 1 MW of yearly production. Two years later, the solar company installed the first megawatt-scale solar project in California. Today solar PV is deploying rapidly with current global solar generation (including thermal) now at 600 TWh, which represents about 2% of global electricity generation, which in turn is about 20% of all final energy use (Source: BP Statisitical Review of World Energy). Solar generation increased by 29% from 2017 to 2018 but remains a minor part of the energy system despite an average growth rate over the last decade of around 50% per year.
But this development from first invention at Bell Labs in 1954 and first use in 1962 has taken over 65 years to scale to 2% of the electricity system, yet it was born out of the Apollo project. While solar may be entirely fit for purpose in space based systems, that still isn’t the case on earth, where the day-night cycle, seasons, latitude and weather all factor into its usefulness. A large scale (e.g. big city, >1 million people) generation system that can rely on solar PV for 100% of its energy doesn’t exist yet, although a smaller solar thermal system with molten salt storage now operates in Morocco.
Of course the most visible outcome of Apollo was the big step forward in manned space travel, with huge hopes as the 1960s came to a close of a golden age emerging. In his 1968 film 2001: a Space Odyssey, Stanley Kubrick imagined vast space stations, a Pan Am shuttle service and manned bases on the moon.

By 2012, with solar PV growing rapidly, not only had Pan Am long vanished, but the USA had no manned launch capacity given that the Space Shuttle programme was at an end. It would have been a brave futurist that made such a statement back in 1969. Rather, the USA currently relies on the launch capacity of Russia, using technology that has changed little since the 1960s. However, a new generation of advanced heavy lift rocketry is emerging from the private sector in the USA.
Nevertheless, the space programme and related government and private efforts within the USA in the 1960s contributed enormously to human technical progress, with the computing developments at the time giving rise to the internet revolution which shows every sign of being as trans-formative as the industrial revolution in the 1800s. That revolution could yet have a significant impact on the energy system, but such a change is not yet clear.
What is apparent from the Apollo programme is that big focused efforts do not necessarily give rise to expected outcomes, even if they achieve their short term goals. Such efforts can certainly be game changing, and Apollo was, but in areas not necessarily targeted in the first instance. The other key factor is that large scale change doesn’t come quickly, as has been the case with solar PV. From a climate change perspective, there simply isn’t the time to allow new technologies to germinate and grow on a 60+ year timeline.
All the above raises the question as to what type of approach is needed to deliver broad energy system change over the coming decades. The Sky Scenario, released by Shell in 2018, attempts to illustrate this. It highlights the need for change across multiple fronts, using technologies that largely exist today or at least have a clear line of sight and driven by a strong policy framework. Sky relies on six key factors, with an important underpinning licence for change from society. It requires;
Embedded within this are perhaps multiple Apollo programmes, across many countries and sectors, also requiring some level of collaboration across national borders and utilising well-funded public-private-partnerships . Those programmes must cover all the key sectors and engage at every aspect of the technology cycle, but particularly the need to take technologies across the so-called ‘valley of death’ by ensuring sufficient early deployment to achieve significant cost reductions. This was done very effectively for solar PV within the German Energiewende over the last decade, although that programme relied on the rapid scale-up of PV-Cell manufacture in China.
The ‘Apollo programme’ for climate is global in nature and is illustrated below.


Almost all scenario thinking that relates to the goal of net-zero emissions during the second half of this century has to consider the role of negative emission technologies. These are mechanisms and approaches which result in the removal of carbon dioxide from the atmosphere and its sequestration in the biosphere (e.g. trees) or lithosphere (i.e. geological storage). This is necessary because we are very unlikely to see out the century with a complete end to fossil fuel use, industrial processes and land change practices all of which lead to the release of carbon dioxide into the atmosphere. Further, the application of carbon capture and storage on facilities such as cement plants and steel mills won’t deal with remaining emissions from mobile sources such as aviation and shipping so removal elsewhere must be done to balance these remaining sources. In addition, many scenarios utilise negative emission technologies as a way to correct the overshoot of goals from earlier in the century, effectively mopping up carbon dioxide released earlier.
There are a number of ways in which carbon dioxide can be removed from the atmosphere, with the simplest being an expansion of the biosphere through reforestation. But as was illustrated in the Shell Sky scenario, even very large scale reforestation isn’t sufficient to balance ongoing fossil fuel use. Global reforestation of some 700-800 million hectares of land (an area the size of Brazil) shifted the outcome in 2100 from 1.75°C (midpoint of a range reflecting uncertainty) to 1.5°C, which required a sink of some 10 Gt carbon dioxide per annum (current fossil fuel use results in some 32 Gt of carbon dioxide emissions – Source: IEA).
In addition to reforestation, the Sky scenario utilises CCS for industrial facilities and incorporates bioenergy production with carbon capture and storage (BECCS) to act as a negative emission technology (see illustration below), giving a total geological based sink of about 10 Gt per annum. BECCS hardly exists in practice today but a 1 million tonne per annum facility is operating in the USA. The technology is well understood and effectively a commercial proposition given the right CO2 pricing system.


Apart from reforestation and BECCS, another technology exists to remove carbon dioxide from the atmosphere, known as direct air capture (DAC). This technology captures the carbon dioxide from the very low concentration in the atmosphere and then makes it available for use or geological storage (DACCS). A small demonstration plant is running in Iceland as part of a much larger geothermal power complex and I was fortunate to be able to visit it a few weeks ago.

Sitting within the ON Power Geothermal facility sits a single Climeworks air capture unit. It takes in air with a carbon dioxide concentration of some 410 ppm (ambient atmospheric conditions) and vents air with a concentration at about 100 ppm. An amine system acts as the sorbent and 4-6 times per day the unit recharges itself by using geothermal energy to heat the amine sorbent and release the carbon dioxide under controlled conditions.


That carbon dioxide then joins a larger carbon dioxide stream (from the geothermal plant) and is injected into the subsurface where it reacts with various minerals to form carbonates, effectively fixing itself into the geology.


This single unit captures and stores approximately 50 tons per annum of carbon dioxide, which is about enough to balance the emissions of eight Icelanders, but only three American citizens. This is very much a pilot unit for demonstration and proof of concept purposes, with plans by Climeworks for scaling the technology.
In the Sky Scenario we chose to use BECCS rather than DACCS as our negative emission technology because BECCS is visible and scalable today. This is because all the related processes and practices like biomass collection and use, geological storage and carbon dioxide transport are all scalable or have been scaled. As such, a scaled systems approach for BECCS could be envisaged in the decades ahead. In the case of DACCS, the scope is potentially huge, but the development pathway for this technology probably has some way to go. This is illustrated by the debate underway in academic circles about the cost of DACCS. DAC is challenged simply by the vast quantity of air that must be processed to extract every ton of carbon dioxide. Today, BECCS can be visualised as a cost effective technology whereas that is not yet the case for DACCS.
Ultimately DAC may also have another use, that being the manufacture of synthetic fuels and materials. Even if society eventually stops extracting fossil fuels, it’s very unlikely that we will stop using hydrocarbons, they are just too useful. But manufacturing them from scratch needs a source of carbon and a source of hydrogen, both of which could come eventually come from renewable energy powered processes. For carbon, it would be DAC and for hydrogen it would be electrolysis of water. Combined and with enough energy, you can make pretty much anything. But scaling this technology is a daunting prospect, which I wrote about a few years ago with reference to the manufacture of synthetics Jet A1 for aviation. All of these technologies will also require years or perhaps decades of development to see significant cost improvements emerge.
It was fascinating to see this technology in action, albeit at a very small scale. Whatever finally emerges, it probably won’t look anything like the plant in Iceland, but we shouldn’t underestimate the ability to innovate in the face of real need and commercial opportunity. It will likely take a long time, but later in the century it may well be the case that planes are flying on air in more than one sense.
Further reading: For a very comprehensive look at greenhouse gas removal technologies, a recent report from the Royal Society is worth a look.
Note: Scenarios are not intended to be predictions of likely future events or outcomes and investors should not rely on them when making an investment decision with regard to Royal Dutch Shell plc securities. Please read the full cautionary note in http://www.shell.com/skyscenario.

Last week the Climate Change Committee (CCC) in the UK released its much anticipated report which is recommending that the government revise its emissions goal to net-zero in 2050. The Committee notes that this is an appropriate UK contribution towards the global need of meeting the goals of the Paris Agreement. The recommendation also follows in the wake of the IPCC Special Report on 1.5°C, which identified 2050 as the year in which the global economy should attempt to reach net-zero emissions in order to limit warming to 1.5°C with a 66% probability.
The recommendation is a shift from the current UK target which would see the country reach an 80% reduction by 2050, in support of which the country is broadly on track to deliver the first 3 interim carbon budgets to 2022. However, as it looks past 2022 the CCC notes there is insufficient early development of some technologies for the heavy lifting ahead. Examples of this include carbon capture and storage (CCS) and hydrogen for a variety of uses.

Nevertheless, the state of technology development, deployment and availability has shifted since the time of the first UK target back in 2008. The cost of wind and solar has dropped significantly, offshore wind is now a viable proposition, many electric car models are available and while not in the UK, some 20 CCS facilities are now running in various parts of the world. All of the technologies required to do the job set out by the CCC are in plain sight, although a number still require significant UK development for deployment in this country. The CCC report is also very clear on this issue.
2050 is just over thirty years away and that same time period reflecting backwards marks the time that I first arrived in the UK with Shell. In the next 30 years the whole energy system will need to shift to achieve net-zero emissions, but how does that compare with the changes seen over the last 30 years. While two thirds of that period has not been covered by the Climate Change Act and its carbon budgets, all but three years have been covered by the UK ratification of the UN Framework Convention on Climate Change.
The Sankey diagrams below reflect the change over the period, although the most recent from the IEA are 2016, so they won’t show the last two years of renewable energy development.


Overall primary energy consumption has fallen, with the most visible change being the shift away from coal and towards natural gas in power generation. Both bioenergy and renewables have also added to the generation mix. Nuclear plays an important and steady base load function. Natural gas is now the dominant contributor to the current power generation sector and in the past year there have been periods where coal has not played a role at all. Back in 1989 coal made up most of the generating capacity. Oil demand within the UK has hardly changed over thirty years (slightly up) although production has halved.
As noted above, one feature that has surged since 2016 is the proportion of renewable energy in the generation mix. Recent figures from BEIS show that wind and solar have now exceeded nuclear on a quarterly basis.


In the final energy system, the changes are more nuanced. The overall share of electricity has moved from 16.7% of final energy to 20.4%, or a shift of 3.7% points in 27 years. The global rate of change is tracking at 2% points per decade, so the UK is well short of that pace of transition. A net zero emissions economy would likely need electricity to be the major component of final energy, say around 60%, so the UK rate of change will need to shift from 1.37% points per decade to around 11% points in each of the coming decades.
Transport hasn’t shifted at all in the past 30 years, with oil use in transport slightly increasing. Electricity is just starting to creep into this mix, but pure electric vehicles have reached only 0.7% (2018) of new car sales. Worryingly, the total number of petrol and diesel cars registered in the UK in 2018 was unchanged from 2013, a period which has seen the first major push to get consumers to go electric. Reaching net-zero emissions by 2050 will not just mean seeing all new purchases as electric, but seeing all new purchases from about 2035 onwards as electric. It can take up to 15 years to completely turn over the entire on-the-road fleet, although a future government could presumably accelerate this process with a buy-back-and-scrap scheme.
In the industrial sector, energy consumption has dropped by nearly a third, presumably through efficiency improvements as industrial output has hardly changed (see chart below). Importantly, electricity use has stayed largely the same. This means that the sector is gradually electrifying, although again the pace of change is below that required.
UK Industrial Production (1970-2019).

Then there are the tricky bits, where the UK has made only limited progress. The CCC notes that radical change is needed in home heating, including a shift to hydrogen and heat pumps, with support from much better home insulation. But residential natural gas use has marginally increased in 30 years, despite significant improvements in boiler efficiency and the use of electricity instead of gas for new apartment buildings. One highlight in this area is the recent milestone of one million homes now being supplied with biomethane.
The overall change in 30 years has been one of continually falling greenhouse gas emissions, with much of the gain coming from natural gas replacing coal and a fall in industrial energy use. While the impetus for change over the last 30 years was perhaps not as great as it is now, the overall shift is symptomatic of typical energy system dynamics; rapid adjustment has never been a feature, primarily due to the large capital stock involved. Outside the energy sector change over the same period has been dramatic. In 1989 there was no internet, no social media, hardly a mobile phone to be seen and televisions were defined more by their depth than their width. So can the UK reach these sorts of transition rates and achieve the goal of net-zero emissions by 2050?
In the power generation sector, zero emissions should be entirely achievable in that time frame. Renewables are surging and new nuclear capacity is now under construction (although even getting that started took a decade). Similarly, with the models on offer or on their way, passenger vehicles could be entirely electric and various cities across the UK have demonstrated that electric buses are now a viable option. But there is no real sign of change for heavy goods vehicles, shipping or aviation. Perhaps the biggest challenge sits with the use of natural gas in homes and industry. It is easy to use, clean, provides a very high heat load and is backed by extensive infrastructure. Hydrogen and electrification are potential pathways forward, but as noted the electrification rate of change has to shift by nearly an order of magnitude. For hydrogen there are promising signs of change with the government now funding a major programme on supply and conversion of existing facilities away from natural gas.
Finally, there is carbon capture and storage (CCS), which may be a simpler solution in many applications than attempting to dislodge natural gas. CCS in combination with direct air capture (still a nascent technology) may also be needed to balance out emissions in sectors such as aviation. Even the production of hydrogen may be easiest at scale from natural gas, which would then also require CCS. The UK has tried and tried again with CCS, but there is still no operational facility to show for all the efforts made. Yet the UK is both pipeline dense and geologically gifted in terms of storage potential, so deployment could proceed given the right incentives to begin.
The Climate Change Committee have put forward a bold recommendation, but it is not without immense challenge. It ought to be possible to achieve the 2050 goal of net-zero emissions, but it won’t happen without some significant nudging by the government in a number of key areas. Policy decisions over the coming five years may well set the scene for the next twenty, so there is everything to play for.

Over the past three weeks I have been on a voyage from Cape Horn to the Cape of Good Hope, specifically Ushuaia to Cape Town. With good weather for most of the trip, we were fortunate to stop in the Falkland Islands, South Georgia and Tristan da Cunha (some pictures below). Each of these have communities ranging from a few people to two thousand in the case of Stanley and each has found its own solution to providing energy. Of course the other remote activity out here is the need of the ship itself which will have travelled for some 20 days without refuelling and carried 400 passengers and crew across the South Atlantic.
The Falkland Islands has the major settlement of Stanley, a couple of very small towns, a military garrison and numerous remote farms. The Islands have settled on wind power to displace diesel generators, achieving an average of 35-40% displacement and a peak of 54%. Rural wind power has also been a success for the remote farms. The next step is to look at the potential offered by modern energy storage technologies, although flywheels have been used since 2010 for some storage in association with the wind turbines. Given the geography and climate, neither solar or hydro have been a success, apart from some niche applications. But the Falkland Islanders also have a history of burning peat for heat, although this is in decline. Kerosine and diesel are the most common fuels used today.
South Georgia is completely different. Since 2008 South Georgia’s two settlements Grytviken and King Edward Point (KEP) have been powered by hydro electricity. On the slopes above Grytviken there is a dam, originally built by the whalers at the turn of the 20th century. The dam increased the capacity of Gull Lake to feed water to the first hydroelectric power plant in 1914. The electricity produced then was mainly used for lighting the whaling station. The plant was expanded in 1928 to reduce the station’s reliance on imported coal for steam to power the factory. The electricity produced was then used to power winches and other factory equipment. The new turbine house has been built just off the pathway from the settlement to Shackleton’s grave, with the only visible sign of it as a generating station being the small stream of water seemingly running from under the building and into the bay.
Tristan da Cunha has a single settlement of about 270 people and an export factory to process the fish and lobster that are caught around the island. Although much of the electricity system was replaced about a decade ago after a fire, an entirely diesel based system was rebuilt. In recent years some changes have taken place with the installation of a few home solar water heaters, saving on bottled LPG which is used to heat water in Tristan houses. A small solar farm was also constructed west of the fishing factory. It consists of 26 solar panels, aligned to face the northern midday sun and each capable of generating 250 watts, so a combined capacity of 6.5kW. The connection to Tristan’s electricity grid was made on 30th April 2015. There are further plans for change, but the logistics of getting equipment to Tristan is enormously challenging. The island can only be approached by sea and few ships stop there. As we discovered on a second stop there (to pick up a local government person so we could land on Inaccessible Island), weather can quickly close the port and conditions can persist for days. But the case for further change is strong, given the community dependency on the import of diesel fuel and LPG. The eventual solution for Tristan may be a combination of parts. Although there is excellent wind, it can be ferocious at times, bordering on hurricane conditions, which perhaps isn’t ideal for turbine operation. Solar can also be challenging, with thick cloud shrouding the island at times. And although there is ample rainfall, collecting this and channelling it through a hydro plant would also be very difficult given the geography.
This then brings the focus to the key dependency for all remote activities, the transport to get there and transport once there. As was the case for our vessel, all these locations are completely dependent on long distance, self-powered transport and that remains almost entirely powered by liquid fuels coming from petroleum. While renewables are starting to provide local energy solutions for remote activities, the energy for the transport associated with such activities has no immediate zero emission alternatives. Synthetic fuels, either from a biomass / biowaste starting point or formulated from hydrogen and carbon dioxide offer a simple drop-in possibility, but the bio-alternatives are still relatively small scale and the pure synthesis route is still at the pilot plant stage of development. It should be noted that large scale synthesis of fuels from hydrogen and carbon monoxide does exist, but the starting points are coal (SASOL in South Africa) or natural gas (Shell in Qatar). For a net-zero emission synthetic fuel, the hydrogen would need to be produced by electrolysis of water using renewable energy and the carbon extracted from the air as carbon dioxide.
Apart from synthetic fuels, the best prospect for change is perhaps hydrogen itself, in that there is good experience containing and carrying it and fuel cells can power even large motorised vessels such as ships. Nuclear exists on ships in the military, but after an attempt to demonstrate the feasibility of nuclear powered commercial ships in the 1960s, nothing more has come from this form of propulsion. The challenge will lie with the providers of heavy transport; shipping companies, airlines and aerospace companies and large road haulage entities. Perhaps like the remote activities themselves, different solutions will emerge over time for the various requirements faced. Some remote locations may even be well placed to provide hydrogen in that they could have an abundance of renewable electricity to put towards hydrogen production via electrolysis. Scotland’s Orkney Islands are starting to experiment with such a route forward, as recently reported by the BBC.

Albatross chick on West Falkland

King penguins on South Georgia

A king penguin colony on South Georgia

King penguins on South Georgia

Me on Tristan da Cunha

The worlds most remote inhabited island, Tristan da Cunha

Northern rockhopper penguins on Gough Island

Fur seal on Gough Island

Fur seals on Gough Island

Inaccessible Island

Birds returning in the evening to Nightingale Island

Over recent weeks and months there has been considerable discussion in the USA and Canada on clean energy transition pathways, carbon pricing and the Paris Agreement. This has been catalysed by the IPCC 1.5° report, the arrival of new political figures on the scene and the prospect of elections in 2019 and beyond. As I discussed in my recent post on a new report that outlines a pathway for global transition consistent with 1.5°C, very steep emission reductions are called for in North America over the coming decade, as shown in the chart below. For the 1.5° case, a reduction of about 80% is proposed from 2015 to 2030.

Source: Achieving the Paris Climate Agreement Goals – Sven Teske (Editor)
But is such a rapid transition possible for an energy system as large as that found in the USA? This is similar to a pathway that has been proposed by those calling for a Green New Deal in the USA. But it is very different to that proposed by the Sky Scenario, released by Shell in 2018.
In Sky, to reach the goals of the Paris Agreement, global emissions need to peak in the 2020s and be falling by 2030, which happens in large part through an initial mobilization of effort throughout the 2020s. But emissions in the USA don’t get even close to an 80+% reduction in that time. North American emissions peaked around 2005 and are slowly falling, but in Sky the pace of change triples in the 2020s with a significant boost in effort, led by government policies such as carbon pricing and electric vehicle mandates and incentives. But by 2030, emissions have fallen by only 23% compared with 2015.
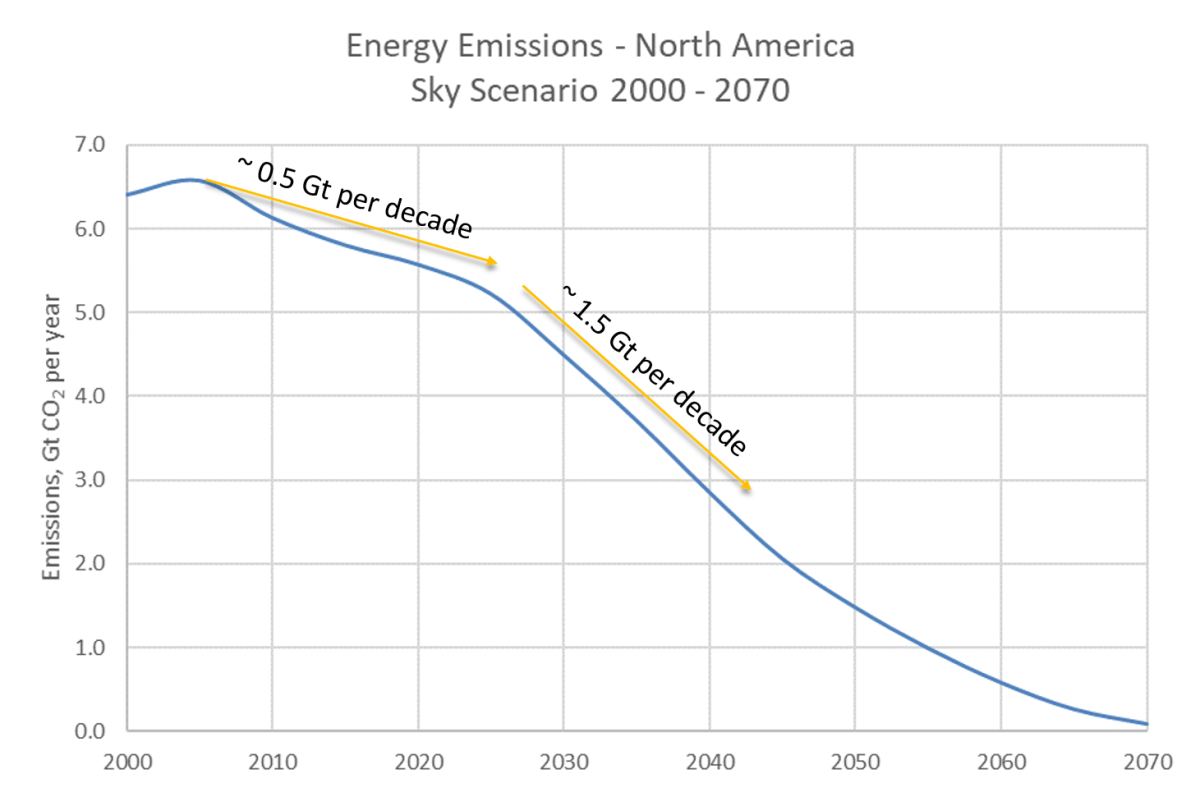
This would constitute a major shift in direction for the US economy. Five significant changes in the energy system in the decade to 2030 in Sky for North America are;
To imagine even more than this is quite challenging. In the EV sector, sales in the USA in 2018 grew rapidly, but still only amounted to 2.1% of the total (Source: EVVolumes.com). A looming issue is the lack of EV models in the SUV / light truck category, although this should start to correct in 2020 with several expected. Nevertheless, this category size makes up a large portion of the US market and it may take some time for consumers to adopt electric versions of their favourite model. While an all EV sales line up might be possible by 2030, an all EV fleet isn’t. For a 100% EV fleet to occur in 2030, all new passenger vehicle sales need to be electric in the next year or two.
In the power generation sector, the multipliers given for wind and solar above, together with an unchanged role for nuclear, results in over half the power generation coming from non-fossil sources by 2030. In Sky, it isn’t until after 2040 before coal is phased out, but natural gas persists in the power mix until the 2060s. A faster transition would require not only a further acceleration in solar and wind deployment, but also the development of major grid storage capacity to replace natural gas. Although there is some grid battery storage today, it amounts to some 2 GWh (Source: PV Magazine), a tiny fraction of the amount that might be needed for a 100% renewable energy system. Further technical developments will be required, or perhaps storage will be combined with ultra-high voltage long distance transmission.
But the most static sector over a ten year period may well be heavy industry; sub-sectors such as cement, iron ore smelting and petrochemicals. While Sky sees some shift towards electricity, the change from 2020 to 2030 is modest. Carbon dioxide emissions remain unchanged at 400 million tonnes per annum over this period. Change is measured in decades rather than years. This is because of the time it takes to develop new industrial processes that don’t use fossil fuels for energy (e.g. hydrogen based iron ore smelting), retrofit exiting capacity and build the necessary infrastructure to support such change (e.g. hydrogen generation).
The next ten years is critical for a transition that meets the goals of the Paris Agreement and this was a feature of the House Resolution for a Green New Deal. Significant changes must be achieved to set the scene for net-zero emissions in the decades following. But to imagine wholesale energy system change in s decade is not realistic. There may well be narrow pockets of very deep change found in parts of the system, but complete change remains a fifty year project.
A new book that outlines a pathway to meet the 1.5°C goal of the Paris Agreement has been released for open access online , but is also available in hard copy from March 7th on Amazon. The work has been conducted by various academic institutions and is largely sponsored by the Leonardo DiCaprio Foundation. The route chosen is to meet all energy needs with renewables such as wind, solar and hydroelectric with the consequent phase-out of fossil fuel use for all energy needs by 2050. Carbon capture and storage (CCS) is not considered as an option, but natural sinks play an important role through large scale land restoration and reforestation. So rapid is the proposed transition that emissions fall sharply from next year (2020) and fossil fuel consumption is reduced by 60% in just a decade. An important additional component is an overall reduction in energy demand through a very strong efficiency drive.

There are six major components to the transition, with the first five relating to objective of 100% renewables for all energy use;
Following the IPCC 1.5° Special Report last October (SR15), it is clear that the lowest risk pathway in terms of climate impact is one that sees emissions fall rapidly, with minimal temperature overshoot before the end of the century. The book effectively follows the pathway P1 (no CCS, rapid fall in fossil fuel use) set out in SR15, although they make more extensive use of land sinks than P1.

Source: IPCC SR15
The IPCC P1-P4 archetype pathways can be categorized in terms of final energy demand and their use of sinks (both natural and artificial, e.g. bio-energy with CCS or BECCS), which also allows a comparison with the Shell Sky Scenario that featured in SR15.

Sky is akin to the SR15 P4 pathway, in that the additional energy demand they both foresee leads to extensive use of sinks to balance overall emissions and deliver a 1.5°C outcome. Within the Sky scenario efficiency plays a major role in curbing demand, but final energy demand still rises throughout the century (see chart below), albeit coming close to a plateau from 2080. This is driven primarily by the demands of some 2-3 billion people moving from modest income to middle income. In addition, there are a further 2-3 billion people moving from little income to modest or even middle income. Even with a major efficiency push, energy demand just doesn’t fall that easily, unless of course consumers hold back in their demand for energy services, e.g. travelling by air.

Sky, like P4, doesn’t see emissions falling until about 2030 in that this is the minimum time the scenario requires to build the necessary political and technical capacity to introduce carbon prices, ramp up production of various technologies and at least begin developing further out technologies such as hydrogen use for metallurgical smelting.
But the new pathway proposed in the publication seemingly allows no time for such change. As noted, under that pathway emissions fall sharply from 2020, yet we are currently in a period of sharply rising emissions (according to an analysis by the Global Carbon Project, 2018 emissions are estimated to have risen by 2.7% compared to 2017). While such a fall would be an ideal outcome and for a better than 50% chance of being below 1.5° is probably required, the difficult question that must nevertheless be answered is by what process this happens? In the Sky Scenario it was proposed that rapid ratcheting of NDCs throughout the 2020s could lead to emissions beginning to fall by 2030.

A further challenge is the decision by the authors not to employ any form of CCS and also phase out all fossil fuel use by the 2050s. For sectors such as aviation, the likely energy source in 2050 will still be hydrocarbon liquids, even if new engine technologies have begun to appear. Some planes that will be flying in 2050 are being built now and there is no line of sight to an alternative technology, so presumably the current generation of planes will continue to be built for several decades.
With no CCS, it means that the fuels must be synthetically produced, either from biomass or by chemical conversion of hydrogen (generated by electrolysis of water using solar energy) and carbon dioxide (extracted from the air), such that they have a net-zero impact on atmospheric carbon dioxide. But these synthesis technologies hardly exist today, although parts of the possible process do (the Shell synthetic fuel plant in Qatar which uses natural gas as the starting point). Just meeting aviation and marine needs with synthetic fuel plants in 2050 would require some 100 large scale facilities, starting from a current position of zero (or perhaps two, if the synthesis reactors in the handful of existing facilities were re-purposed).
A 100% renewable energy world will still require an energy carrier that isn’t electricity, for example for intense heat in certain combustion applications. Hydrogen could be such a carrier and could also be used for energy storage as well as having a role in liquid fuel synthesis. But the scale of a global hydrogen industry to support the renewable energy world would far exceed the global Liquefied Natural Gas (LNG) industry we have today. The LNG industry includes around 300 million tonnes per annum of liquefaction capacity and some 400 LNG tankers. That amounts to about 15 EJ of final energy compared to the current global primary energy demand of 500 EJ. In a completely new energy system in 2050, a role for hydrogen as an energy carrier that reached 50 EJ would imply an industry that was four times the size of the current LNG system. The current LNG system has emerged over a period of 60 years; building a system four times the size in 30 years seems unlikely.
There is no doubt that the 1.5°C Paris pathway outlined in the book is an incredibly ambitious one, but it may even be beyond the bounds of the possible. It will take some time to review the full publication, so I hope to report back in the coming weeks on various aspects of the story presented.

Over the past two years, on a timetable similar to that of the IPCC 1.5°C report, the Shell scenario team has been working towards the launch of the Sky scenario, which took place a few months ago. Sky is based around the principal goal of the Paris Agreement, i.e. limiting the rise in surface temperature to well below 2°C. The exact definition of ‘well below’ is open to discussion, but in Sky the outcome sees warming limited to 1.75°C (in 2100 with a 50% chance), which can be interpreted as an 85% chance of being below 2°C.
As discussed at length in the Sky publication, the emissions management task that underpins this outcome is extraordinarily rapid and comprehensive in that it must touch every aspect of the energy system and even extend beyond that into industrial greenhouse gases, agriculture and land use change. While there is a great deal of discussion about energy transitions in society, much of it focuses on the deployment of renewable energy for electricity generation and more recently the extent to which electric passenger cars will permeate the global market. While these are both important sectors, they do not represent a complete picture of the transition or emissions.
In the Sky scenario, electricity is largely decarbonised by 2050 and passenger car sales are almost entirely EV by the same year, but the journey is just beginning in 2050 for other parts of the energy system. For example, 2050 is the first year in which hydrogen appears in the Sky dataset for aviation; up until that point aviation is entirely hydrocarbon based, albeit some of this is in the form of biofuels. Even passenger car gasoline use continues well past 2050 because of the large stock of vehicles in society. These are not easily displaced and a long but shrinking tail of continued use stretches into the 22nd century.
Long tails will be a feature of the energy transition this century and cannot be easily dealt with. Even today in the United Kingdom, it is still possible to see sacks of coal being delivered for home heating, a practice that most people think vanished decades ago. These long tails will add up and in Sky, come the end of the century, continued global coal, oil and gas use is not that different to the 1960s, although it is in steady decline. The difference is that carbon capture and storage, in some form, is used to manage the emissions impact.
At the start of the transition the story has many similarities but turned upside down. For example, solar PV first appeared in the 1970s, even on calculators, but it then took 40 years for solar PV to reach 1% of global electricity generation. In Sky, we don’t see hydrogen appearing in heavy industry as an energy source until the 2050s, because it hardly exists today. In the metallurgical sector, there are plans for a first demonstration of hydrogen smelting but shifting to large scale commercial deployment will likely take 20-30 years, at best.
Against this background comes the IPCC Special Report on 1.5°C (IPCC SR15), released on October 8th in Korea, after the final meeting of the authors. Not surprisingly, it calls for an extraordinarily rapid transition, with emissions falling sharply from 2020 in the P1, P2 and P3 type pathways (IPCC SR15 archetype pathways). The Shell Sky scenario is referenced in the IPCC SR15 report (see chart below) given the success it demonstrates in limiting warming, but is called ‘ a delayed action pathway relative to others’, simply because emissions don’t show a clear downward trend until the late 2020s (more like a P4 pathway). After that, transition proceeds rapidly.

It is right that the climate science community should call for a sharp reduction in emissions as that is the lowest risk pathway for limiting warming, but such an outcome would require all of the policies in place by 2020 that Sky has posited could develop by 2030. For example, Sky sees carbon pricing implemented globally by 2030 with prices around $40 per ton of CO2 (a range of $25 to $60). In 2018 carbon pricing in some form covers less than a quarter of global activities and the level ranges from $5 to $30, with a few exceptions at higher levels.

The Sky publication also includes a sensitivity which sees the 1.5°C goal reached (i.e. surface temperature warming below 1.5°C in 2100 with a 50% probability). But this outcome is not achieved in Sky by simply speeding up the energy transition; Sky already represents the fastest real-world transition that appears possible today together with a relatively short capacity building period, i.e. the time it takes to implement robust policy frameworks globally. Rather, an additional measure is incorporated in the form of large scale reforestation, which introduces an increasing carbon sink from the early 2030s. The scale of that is significant and equivalent to increasing global forest cover by an area the size of Brazil over the coming decades. The use of such a carbon sink brings forward net zero emissions by about a decade to 2060, or 30 years after emissions start falling in Sky. IPCC SR15 recommends that emissions fall from 2020 and reach net zero by 2050, also a 30-year gap.
The total carbon budget in Sky from 2018 through to 2100, a measure used in IPCC SR15, is 800 Gt CO2. This slightly exceeds the IPCC mid-range budget (the 50 percentile in transient climate response to cumulative emissions or TCRE for 1.5°C, Table 2.2 in the report) of 770 Gt. IPCC SR15 notes that budget estimations contain considerable uncertainty, including uncertainty related to overshoot pathways, of which Sky is one. SR15 notes that if these budgets are exceeded and the use of sinks is envisaged to return cumulative CO2 emissions to within the carbon budget at a later point in time, additional uncertainties apply because the TCRE is different under increasing and decreasing atmospheric CO2 concentrations due to ocean thermal and carbon-cycle inertia. This asymmetrical behaviour makes carbon budgets path dependent in case of a budget and/or temperature overshoot. Although potentially large for scenarios with large overshoot, this path-dependence of carbon budgets has not been well quantified for 1.5°C- and 2°C-consistent scenarios and as such remains an important knowledge gap.
The short story here is that the IPCC SR15 has set out a formidable challenge for society, with an accelerated timetable to minimise uncertainty. While Sky takes a different approach to the feasible rates of transition to that set out by IPCC, it clearly demonstrates that a possible pathway forward exists.