Over the last three weeks I have been working my way from Chicago to Santa Monica on Route 66, some 2,400 miles of lost highway which for decades were the lifeblood of American motoring. Route 66 had its beginnings in 1926 as the US started building a national highway system.
As the automobile became more affordable, Route 66 boomed and the towns along the way became thriving stopovers, with motels, gas stations and diners popping up throughout the country. It was a defining era for the US. The era was also a defining period for the oil industry. Towns like Ash Fork, Arizona, which has never had a population of more than 1000, housed a dozen gas stations, several motels and numerous places to eat. The gasoline stations reflected not only the demand for fuel but also the intense competition that was created to supply it.
But with the decision to build the Interstate system, Route 66 slowly vanished and the towns along the highway were increasingly bypassed. The gas stations closed and the motels slowly vanished. Today, a drive along Route 66 is a treasure hunt for what remains, some of it in ruins and some beautifully restored by motoring enthusiasts for the new tourist trade.
But Route 66 isn’t just about the demand for gasoline, it’s also about the supply. The highway cuts through Oklahoma, an important oil producing region of the US and home to one of the major global oil pipeline hubs. Just north of Route 66 between Tulsa and Oklahoma City sits the town of Cushing. It’s perhaps not a place many people have heard of, but it is the delivery point for a West Texas Intermediate (WTI) oil futures contract purchased on the New York Mercantile Exchange. What happens in Cushing can impact the world as was seen in 2020 with the COVID-19 pandemic underway. WTI prices briefly went negative, reflecting the fact that storage in Cushing was effectively full.
But change is underway. Throughout Route 66 in Texas and New Mexico, wind turbines can be seen in their hundreds, and electric vehicle charging stations are beginning to appear in some of the towns along the route, reflecting the new demand from American motorists.
How Route 66 is shaped by the future remains to be seen, but today it still represents a fascinating historical portrait of motoring and the oil industry in the USA.
I recently attended an emission trading conference in Paris and like many such events in the EU now, one of the first items on the agenda (and in this case it was the first) was a presentation and discussion on the US Inflation Reduction Act (IRA). The fact that the IRA isn’t an emissions trading system didn’t matter. The IRA has upended the climate discussion in the EU in that projects are happening in the US, and change is underway, while a key green technology sector like the EU wind industry is facing headwinds.
After years of attempting to implement carbon pricing but finding it to be politically impossible to do so, the USA has taken a very different track to the EU where the flagship policy is the EU Emissions Trading System (EU ETS) and its carbon price, currently around €80 per tonne CO2. The IRA offers tax credits across a range of technologies, from electric vehicles to direct air capture (DAC), with the benefits for the latter of up to $180 per tonne CO2 when geological storage is involved (DACCS). Earlier this year Goldman Sachs estimated that the IRA could deliver as much as $1.2 trillion of incentives by 2032 and spur $2.9 trillion of cumulative investment opportunity across sectors for the re-invention of U.S. energy system. Little wonder the IRA features at the top of a climate change conference agenda in the EU.
Meanwhile, presentations about the EU ETS at the same conference pointed to a system with growing ideological constraints. Top of the list is the near absence of a carbon removals framework such that this key set of technologies can start featuring in EU ETS driven investment decisions. Rather, it almost felt as if the EU is just expecting emissions to fall to zero by the early 2040s, thus avoiding any major need for removals. It isn’t clear how this might happen in practice and certainly none of the scenario work done in Shell points to anything even close to such an outcome. Even in our most ambitious scenario, Sky 2050, the global energy system will remain bound to fossil fuel use right through the middle of the century and beyond, albeit sharply decreasing, with the end of the fossil fuel era not even in sight until the 2080s. As such, carbon removal technologies like direct air capture with storage (DACCS) need momentum today, which is happening in the US under the IRA, but the equivalent investment in Europe is essentially zero.
The different approaches in the EU and USA are highlighted in our Energy Security Scenarios, released a few months ago, through the use of behavioural archetypes. The EU is a Green Dream region, meaning that they are ideologically attached to removing fossil fuels from the energy system as fast as possible. By contrast, the USA, along with other major resource countries, are characterised by the tagline Innovation Wins, which means that they will tackle the issues in the energy system through innovation, but with pragmatism prevailing. If that means using fossil fuels in some applications and developing DACCS to manage emissions, then so be it. No ideology, just money and science.
One of the strengths of the World Energy Model (WEM) that sits behind our scenarios is the ability to drill down into single countries, technologies in countries or sectors in countries. And I have done just that for the USA with the WEM to illustrate the pathways for our two new scenarios, Sky 2050 and Archipelagos. These are stories that are full of technology and innovation, with rapid change resulting.
Firstly, just a reminder of the two scenarios:
Archipelagos depicts a global narrative of shifting political winds driving the transition away from fossil fuels. Despite encountering challenges, the pace of the transition accelerates due to heightened security concerns and competition. This scenario envisions a world where energy security takes precedence over emission management.
Sky 2050 explores a world in which long-term climate security is the primary anchor. Society rapidly moves towards net-zero emissions but doing so requires major interventions from policymakers in the energy system.
The scenario timeline for the USA through to 2060 is shown below, built by extracting multiple different views of the US energy system from the WEM database.
A defining feature is that even in the slower transition, Archipelagos, the USA is closing in on net-zero emissions by 2060, years before other countries. This is linked in part to the IRA today, which establishes momentum behind both transformative energy technologies and CCS, although in the case of the latter not on the scale seen in Sky 2050. One key difference between the scenarios is the complete disappearance of the DAC industry in Archipelagos, whereas it booms in Sky 2050 once high initial costs come down. The emergence of DAC in Sky 2050 also gives rise to a synthetic fuel industry in the USA, which tempers hydrogen use for aviation later in the century compared to Archipelagos.
In Sky 2050 net-zero emissions is reached in the late 2040s in the USA, before the current 2050 goal.
But both scenarios for the USA see an all-electric passenger car market, hydrogen road freight, electric airplanes, expanding biofuel production, hydrogen jet travel (not shown above for Archipelagos but from 2050), solar and wind expansion and of course falling emissions.
In the USA, at least, innovation does win!
Note: Shell Scenarios are not predictions or expectations of what will happen, or what will probably happen. They are not expressions of Shell’s strategy, and they are not Shell’s business plan; they are one of the many inputs used by Shell to stretch thinking whilst making decisions. Read more in the Definitions and Cautionary note. Scenarios are informed by data, constructed using models and contain insights from leading experts in the relevant fields. Ultimately, for all readers, scenarios are intended as an aid to making better decisions. They stretch minds, broaden horizons and explore assumptions.
For the people in a scenario team, it’s always exciting when something that you have discussed in your work suddenly starts to appear. It’s even more exciting when it happens in the company that you work for. So it is with direct air capture (DAC). Last week Shell announced it has taken the decision to build a DAC industrial-scale demonstration unit at the Shell Technology Center Houston (STCH), in the USA. With a targeted start-up in 2025, the company aims to prove the technical viability of its in-house developed solid sorbent technology.
Shell’s Direct Air Capture technology discussed
The Shell announcement is but one of several DAC announcements in recent months, with many of the projects in the USA where the Inflation Reduction Act (IRA) is pumping over a billion dollars into this nascent technology. Also last week The U.S. Department of Energy (DOE) announced that DAC projects in Texas and Louisiana to remove more than 2 million tonnes of carbon dioxide per year from the atmosphere will get over $1 billion in federal grants. Two major projects the DOE selected are Project Cypress in Louisiana, run by Battelle, Climeworks Corporation and Heirloom Carbon Technologies; and the South Texas DAC Hub in Kleberg County, Texas, proposed by Occidental Petroleum’s subsidiary 1PointFive and partners Carbon Engineering Ltd (whom Oxy have subsequently announced they are acquiring) and Worley.
I have written about DAC in several posts, but it’s worth revisiting this in the context of these announcements and through the lens of The Energy Security Scenarios. Two scenario stories are presented, Sky 2050 and Archipelagos. They explore the tension that now exists between what world leaders promise on climate change at events such as COP26 in Glasgow and the reality those same leaders face when near term energy system disruption occurs, and immediate decisions must be taken to address the situation.
Archipelagos depicts a global narrative of shifting political winds driving the transition away from fossil fuels. Despite encountering challenges, the pace of the transition accelerates due to heightened security concerns and competition. This scenario envisions a world where energy security takes precedence over emission management.
Sky 2050 explores a world in which long-term climate security is the primary anchor. Society rapidly moves towards net-zero emissions but doing so requires major interventions from policymakers in the energy system.
In the Archipelagos story there is no DAC, at least not until the tail end of the century when it just starts to emerge. This is a story where current efforts come to nothing as other issues take priority – although not without consequence. But in Sky 2050 the technology flourishes and by 2100 it has made a material difference to the temperature outcome. However, it’s not a simple journey. Today there is a lot of discussion around DAC, but it remains a nascent and relatively expensive technology with capture costs of several hundred dollars per tonne of CO2, although estimates and statements of cost vary widely. The goal is to progressively bring down the cost, perhaps to around $100 per tonne CO2, but it is nowhere near this level today. So in Sky 2050, even though DAC emerges, nothing truly material happens until 2040, still over 15 years away. This is because new technologies in the energy sector typically take a generation (20+ years) to mature before material change is visible. DAC first appeared at least a decade ago, if not more, and is now only just being turned into the first larger scale projects. Compare this to solar PV, it first appeared in the late 1950s, with the first commercial power generation installation (6 MW) in 1983. In 2022 solar PV produced about 5% of global electricity, 40 years after the first project.
In Sky 2050 the first material appearance of DAC (5 million tonnes per annum globally) is in 2040 and this is for fuel synthesis, not for geological storage and therefore permanent removal. Presumably this is where the business model lies, despite the economic pull from the IRA. Airlines are likely to create early demand for sustainable synthetic hydrocarbon fuel (replacing crude oil derived Jet A-1) due to their need to transition towards net-zero emissions by 2050, but without a replacement propulsion technology. But by the mid-2040s DAC with geological storage (DACCS) has appeared and by 2050 is triple that for synthesis, with the two combined at over 500 million tonnes per annum. While the scale of DAC by 2050 is important at 500 million tonnes, this isn’t the technology that delivers NZE in 2050. It just isn’t big enough by then. NZE in 2050 comes through multiple other channels, with conventional CCS and land use change being the two big differentiators in a world that still uses considerable amounts of fossil fuel (albeit reduced by nearly two thirds from current levels).
Nevertheless, the scale up of CCS will be invaluable for DACCS, laying the groundwork by building the infrastructure for the transport and storage of CO2. At the moment, the focus is understandably on the capture side of DACCS, but it would be a major lost opportunity if the transport and storage infrastructure was not ready to take advantage of large scale DACCS when it does arrive.
Where DACCS has a major role to play is in the second half of the century. By 2100 this is an industry that has grown from nothing today to 6.6 billion tonnes of CO2 per year. In gas volume terms that’s like 2.2 billion tonnes of natural gas, which means that the CO2 gas handling infrastructure for DACCS in 2100 is getting towards the scale of global natural gas infrastructure today. From 2050 to 2100 the DACCS industry removes over 150 Gt of CO2 from the atmosphere, equivalent to 0.1°C of warming. This is an important contributor to the reduction in warming in Sky 2050 from 1.67°C (peak) to 1.22°C (in 2100).
And with 5.4 Gt of DACCS capacity in place, warming could conceivably be reduced by about another 0.15°C every 50 years after 2100. Direct air capture (and its combination with geological storage) is a technology for the longer term future, even though it will begin to bring more immediate benefits in the fuel synthesis industry in the shorter to medium term. But to build an industry that eventually handles CO2 on the scale we imagine in Sky 2050 by the end of this century, means starting now. While detractors have been quick to criticise DAC, in part because of a view that resources need to be focussed elsewhere today, fully addressing the climate issue means adopting a range of technologies and pursuing them relentlessly. The emissions problem we have is only partly solved by renewable energy, with the full solution coming when we can combine new energy sources with the management of CO2 from legacy energy sources. That is where DAC plays a critical role.
Note: Shell Scenarios are not predictions or expectations of what will happen, or what will probably happen. They are not expressions of Shell’s strategy, and they are not Shell’s business plan; they are one of the many inputs used by Shell to stretch thinking whilst making decisions. Read more in the Definitions and Cautionary note. Scenarios are informed by data, constructed using models and contain insights from leading experts in the relevant fields. Ultimately, for all readers, scenarios are intended as an aid to making better decisions. They stretch minds, broaden horizons and explore assumptions.
For quite a few years now I have found myself in front of a class of MBA students at a number of different institutions giving a talk on climate change and the energy transition. Each has their own take on how to tackle the subject. Some leave it up to me but at Harvard University the talk was entitled ‘The Future of Fossil Fuels in the Energy System’ and the session included a presentation from a well placed analyst in the finance sector. One common feature is the high level of interest in the class and the diverse and sometimes difficult range of questions that come my way. As such, the sessions are always enjoyable and something of a highlight of my job.
But another common feature is that my lecture was typically part of a module within the course that is optional and as such often populated by students who may have worked in the energy industry or have a close association with it. At least until recently, I didn’t get the impression that the bulk of the students saw energy and climate as pivotal to their future business success. But that appears to be changing.
In my experience, one of the leading business schools in promoting the climate issue as a much more important component of an MBA course is Tuck School of Business at Dartmouth College in Hanover, New Hampshire. I am particularly fortunate to have spoken there in person a few times, although more recently it has been a Zoom experience for the students. Professor Anant K. Sundaram leads in this area for Tuck and he and Robert Hansen are to be commended for elevating the subject further, with the publication in January of The Handbook of Business and Climate Change.
The Handbook is a weighty document, some 560 pages long, and covers a swathe of subjects from decarbonising electricity and managing aviation to carbon pricing, green bonds and ESG investing – to name but a few of the many subjects. Sundaram and Hansen haven’t written the book in entirety themselves, but instead sought out numerous authors to write the various chapters. I was honoured when Professor Sundaram asked me to write one of the opening chapters, helping set the scene for the book.
After some thought, I decided to call the chapter ‘The End of Combustion?’, perhaps to challenge the orthodoxy that is emerging around the future role of fossil fuels throughout society. In the chapter I explore the transition pathways that have appeared in recent years and where they may be taking us and the extent to which fossil fuel use might end by 2050. Regular readers of this blog may notice a few extracts from my posts or should at least recognise some regular themes. Perhaps not surprisingly the chapter raises the issue of natural and engineered carbon sinks and the many challenges society faces in creating a vast industry that few seem to actually want yet many recognise we desperately need.
This may not be a book for everyone and as a university textbook it’s unlikely to appear on the New York Times Best Seller list, but as an aide for business school students it should prove invaluable. Accelerating the energy transition will require all of the skills that a good business school seeks to impart on its students and all of the talented people that graduate as well. ‘Energy and climate change’ is no longer an optional module for the interested, but an essential part of a business background. There isn’t a company in the world that doesn’t use energy in one form or another and there’s unlikely to be a company that isn’t impacted by the transition or climate change or both.
In April, at the opening of the White House Climate Summit, President Biden announced the United States Nationally Determined Contribution (NDC) for the period up to 2030, encompassing a target of greenhouse gas reductions 50-52% below 2005 levels. The US Greenhouse Gas inventory is available on the US EPA website and is summarised in the table below.
Sector and gases(Mt CO2e)
2005
Latest data for 2019
CO2 Fossil Fuel Combustion
5753.5
4856.7
CO2 Non-Energy & Industrial
381
399.1
CH4 from all sources
686.1
659.7
N2O from all sources
455.8
457.1
HFCs, PFCs, SF6, NF3 from various industries
146.5
185.6
Total Emissions (Sources)
7423
6558.3
LULUCF Emissions
16.8
23.5
LULUCF Carbon Stock Change
(804.8)
(812.7)
Net Emissions (Sources & Sinks)
6635.0
5769.1
Given a baseline of 6635 Mt CO2e, a 50% reduction in 2030 would require US emissions to be 3318 Mt or lower in that year. The 2019 data represents a reduction of 13% over 2005, so the reduction in the next 10 years must be nearly triple that of the last 15 years. The reduction seen to date from fossil fuel combustion is running slightly ahead of the overall improvement, with a reduction from 2005 to 2019 of nearly 16%.
The goal that President Biden put forward is aligned with a strategy that is designed to achieve a goal of net-zero emissions for the US in 2050. Recently, the Shell Scenario team released a US Sketch outlining one possible pathway to such an outcome. The Sketch is illustrated below (N.B. 2020 figures are a pre-pandemic view of US emissions which the US is approaching again as the recovery gains momentum).
The Sketch provides the opportunity to look at the nature of the transition required in the 2020s for the NDC. The Sketch energy system emissions in 2030 are 3440 Mt against a 2005 baseline of 6030 Mt (small differences in baselines result from different categorizations of emissions), or a reduction of 43%. While this isn’t exactly aligned with the NDC, it could be in that the NDC makes specific reference to a major expansion of sink capacity through enhanced soil carbon uptake in the agricultural sector.
Key elements of the journey to 2030 outlined for the US in the Sketch are as follows;
In 2020 (pre-COVID calculation) the US generated 3970 TWh of electricity, with 80% from coal, gas and nuclear. Solar and wind made up less than 10% of the total. By 2030 in the Sketch, the generation mix has shifted to natural gas and solar each making up about 25% of the total, with wind, nuclear and coal combined at around 40%. Notably, total electricity generation has increased to 5720 TWh, or 43% over 2020. This is in a pathway that still sees electricity system emissions at 600 Mt in 2035, the year President Biden has targeted for a zero emission system. His goal is about 5 years ahead of the Sketch.
The increase in electricity consumption comes from an increasing proportion of electricity in final energy, displacing gasoline in cars, natural gas in homes and coal in industry. Electrification is a major lever for decarbonisation. The proportion of electricity as final energy rises in a decade from 22% to 35%, breaking a near century long trend which if continued, would otherwise see it rise to 25% at most.
Over the 2020s, solar generation of electricity grows fastest, increasing by a factor of nearly 12 in a decade. The U.S. installed 19.2 gigawatts (GWdc) of solar PV capacity in 2020 to reach 97.7 GWdc of total installed capacity. With a utilisation factor of 15-20%, this could be expected to generate around 150 TWh of electricity, although the Energy Information Agency reported a total of 130 TWh (perhaps because the capacity at the start of the year was 79 GWdc). In any case, capacity by 2030 will need to grow to at least 1 TWdc, assuming some efficiency improvement in new installations compared to existing facilities. With a year-on-year installation growth of 30%, the US could be installing some 260 GWdc per year by 2030, bringing the total installed capacity to 1.2 TW by the end of that year. Very large scale energy storage will also have to deploy to support solar.
The Sketch also shows a three-fold increase in wind generation throughout the 2020s and importantly, no decline in nuclear generation. The latter becomes increasingly important as other non-intermittent generation sources decline in use.
Electric vehicle (EV) deployment is an important part of the trend towards electrification and it emerges rapidly in the Sketch. By 2030 the US will need to see 20% of all passenger vehicle use as electric, with hydrogen fuel cell vehicles rapidly appearing in the large SUV sector. At the moment, there are about 1.5 million EVs on the road, out of a total US passenger vehicle fleet of some 280 million. To reach a level of 20% EVs in terms of use, sales will need to climb rapidly from some 400,000 vehicles per year now, to over 13 million in 2030, or nearly 80% of all sales. This represents a year-on-year growth rate in EV sales of 42% through the decade.
Road freight makes less use of electricity, although it does impact the lighter end of the freight market. For larger, longer haul freight trucks, hydrogen emerges during the 2020s, with some 200,000 trucks on the road by end of the decade. This is still relatively small, but the sector is non-existent today. In the second half of the century in the Sketch, hydrogen becomes the dominant fuel for heavy road freight.
Natural gas, propane and oil are used widely in the US for cooking and/or heating in homes. Although the majority use electricity for cooking, heating is provided mostly by gaseous hydrocarbon fuels. In the US Sketch, heating and cooking in residences shifts from 13% electricity to 42% electricity in just a decade. Of all the transition tasks ahead, this may be the most challenging in that it involves convincing millions of households, individual consumers and landlords to change their behaviour, refit existing properties, invest money for the change and in some instances make use of a less preferred energy option.
While electricity already plays a significant role in light industry, this is not the case for heavy industry where very high temperatures and high thermal loads are often required for conversion processes. Heavy industry energy use in the US is currently three-quarters gas, coal and biomass and one quarter electricity. This begins to shift rapidly and by 2030 in the Sketch, 40% of energy demand for heavy industry is supplied by electricity. In addition, hydrogen is emerging, with the first industrial installations making commercial use of this fuel. While the amount is small in 2030 it could mean significant development, design and engineering of new processes in a limited amount of time. Alternatively, the amount could point to natural gas being topped up with hydrogen as a mixed fuel for industrial furnaces, prior to converting whole processes over to hydrogen based fuels.
The many changes across the energy landscape result in steep decline in the use of fossil fuels in the Sketch, with coal falling fastest. By 2030 there is a 40% reduction in coal use, a 14% reduction in natural gas and a 25% reduction in oil within the economy, compared to 2020 (pre-COVID) use.
But even by 2050 in the Sketch, natural gas and oil still play an important but significantly diminished role in the US economy. That points to the need for carbon capture and storage (CCS), both directly linked to facilities and indirectly as an atmosphere removal mechanism (e.g. BECCS). The US already has the most mature CCS industry in the world, underpinned by years of enhanced oil recovery using carbon dioxide. But an order of magnitude change is required here as well during the 2020s, with a shift from some 30 mtpa carbon dioxide stored to some 300 mtpa.
While the Sketch does not require nature based solutions (NBS) for the US energy system to reach net-zero emissions by 2050, natural carbon sinks do provide an additional lever to support the transition and the NDC also discusses this aspect of emissions mitigation. In the US, national forests cover 193 million acres, an area larger than Texas. Apart from their significant bioenergy potential, forests act as natural carbon sinks. The US could reduce CO2 emissions by up to 300 million tons a year by 2050 through afforestation – the planting of new trees where there were none before. While new forests represent significant additional sinks, there is also potential to expand areas such as wetlands and mangrove swamps, and perhaps most importantly to encourage farmers to adopt practices that enhance soil carbon. The US NDC references this opportunity.
The rates of change outlined above are substantial, with year-on-year growth rates for several new energy technologies of 20-50%, depending on the sector. While growth at this level can be sustained when a sector is very small and this has been observed for renewable energy deployment, it becomes increasingly difficult as the sector grows and absolute levels of deployment become very large. Many of the sectors mentioned will face this issue during the 2020s. Nevertheless, the Sketch was designed to show what is possible given the right policy levers for innovation and deployment, sufficient and targeted financing and overall transition design.
Note: Scenarios don’t describe what will happen, or what should happen, rather they explore what could happen. Scenarios are not predictions, strategies or business plans. Please read the full Disclaimer here.
Today a new energy transition is gaining pace in the US, built on the back of the falling costs of wind, solar and batteries. But what might a rapid transition to net-zero CO2 emissions look like in the US?
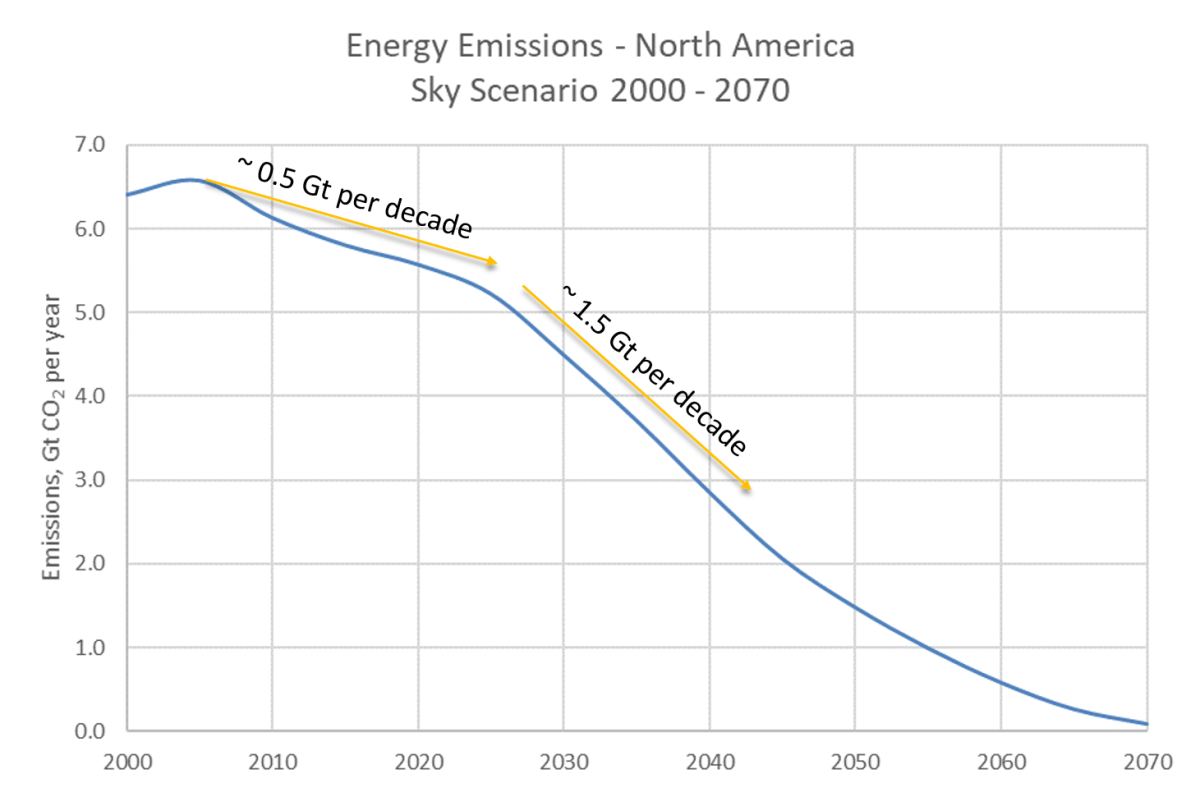
Over recent weeks and months there has been considerable discussion in the USA and Canada on clean energy transition pathways, carbon pricing and the Paris Agreement. This has been catalysed by the IPCC 1.5° report, the arrival of new political figures on the scene and the prospect of elections in 2019 and beyond. As I discussed in my recent post on a new report that outlines a pathway for global transition consistent with 1.5°C, very steep emission reductions are called for in North America over the coming decade, as shown in the chart below. For the 1.5° case, a reduction of about 80% is proposed from 2015 to 2030.
Source: Achieving the Paris Climate Agreement Goals – Sven Teske (Editor)
But is such a rapid transition possible for an energy system as large as that found in the USA? This is similar to a pathway that has been proposed by those calling for a Green New Deal in the USA. But it is very different to that proposed by the Sky Scenario, released by Shell in 2018.
In Sky, to reach the goals of the Paris Agreement, global emissions need to peak in the 2020s and be falling by 2030, which happens in large part through an initial mobilization of effort throughout the 2020s. But emissions in the USA don’t get even close to an 80+% reduction in that time. North American emissions peaked around 2005 and are slowly falling, but in Sky the pace of change triples in the 2020s with a significant boost in effort, led by government policies such as carbon pricing and electric vehicle mandates and incentives. But by 2030, emissions have fallen by only 23% compared with 2015.
This would constitute a major shift in direction for the US economy. Five significant changes in the energy system in the decade to 2030 in Sky for North America are;
Doubling of wind generation. This should be a relatively easy goal, but on the basis of current build rates it would not be met. Current US capacity is around 90 GW with a recent quarter seeing 0.6 GW added.
A six-fold increase in solar generation. Current build rates would deliver about a third of the required capacity by 2030.
Coal use down by a third.
Natural gas demand plateaus and is the same in 2030 as it is in 2020.
Electric vehicle (EV) sales boom and by 2030, 20% of all vehicle miles traveled are in electric vehicles.
To imagine even more than this is quite challenging. In the EV sector, sales in the USA in 2018 grew rapidly, but still only amounted to 2.1% of the total (Source: EVVolumes.com). A looming issue is the lack of EV models in the SUV / light truck category, although this should start to correct in 2020 with several expected. Nevertheless, this category size makes up a large portion of the US market and it may take some time for consumers to adopt electric versions of their favourite model. While an all EV sales line up might be possible by 2030, an all EV fleet isn’t. For a 100% EV fleet to occur in 2030, all new passenger vehicle sales need to be electric in the next year or two.
In the power generation sector, the multipliers given for wind and solar above, together with an unchanged role for nuclear, results in over half the power generation coming from non-fossil sources by 2030. In Sky, it isn’t until after 2040 before coal is phased out, but natural gas persists in the power mix until the 2060s. A faster transition would require not only a further acceleration in solar and wind deployment, but also the development of major grid storage capacity to replace natural gas. Although there is some grid battery storage today, it amounts to some 2 GWh (Source: PV Magazine), a tiny fraction of the amount that might be needed for a 100% renewable energy system. Further technical developments will be required, or perhaps storage will be combined with ultra-high voltage long distance transmission.
But the most static sector over a ten year period may well be heavy industry; sub-sectors such as cement, iron ore smelting and petrochemicals. While Sky sees some shift towards electricity, the change from 2020 to 2030 is modest. Carbon dioxide emissions remain unchanged at 400 million tonnes per annum over this period. Change is measured in decades rather than years. This is because of the time it takes to develop new industrial processes that don’t use fossil fuels for energy (e.g. hydrogen based iron ore smelting), retrofit exiting capacity and build the necessary infrastructure to support such change (e.g. hydrogen generation).
The next ten years is critical for a transition that meets the goals of the Paris Agreement and this was a feature of the House Resolution for a Green New Deal. Significant changes must be achieved to set the scene for net-zero emissions in the decades following. But to imagine wholesale energy system change in s decade is not realistic. There may well be narrow pockets of very deep change found in parts of the system, but complete change remains a fifty year project.
Note: Scenarios are not intended to be predictions of likely future events or outcomes and investors should not rely on them when making an investment decision with regard to Royal Dutch Shell plc securities. Please read the full cautionary note in http://www.shell.com/skyscenario.
Later this year, the IPCC Special Report on 1.5°C will be released and it is very likely to put great emphasis on the importance of carbon capture and storage (CCS) and the role that it needs to play in containing global emissions such that a net-zero emissions outcome can be achieved and within the time needed to limit average surface temperature warming to 1.5°C. This is not a surprise, given the similar story in the IPCC 5th Assessment Report in 2013 for a 2°C outcome. Yet despite the recognition of the role of CCS, the technology is not being deployed at the rate necessary to make a difference, not just to emissions, but also to the cost of the technology itself which will almost certainly fall as experience is gained, supporting infrastructure is built and innovation kicks in.
The Global Carbon Capture and Storage Institute (GCCSI) track CCS development and they note that only 17 CCS Facilities (>400kt CO2 per annum each) with a total capture capacity of approximately 30 MtpaCO2 are operating today. Just five new facilities are under construction.
Source: GCCSI
Recently in The Guardian (Australian edition), an article appeared under the title “It’d be wonderful if the claims made about carbon capture were true”, which turned out to be more a critique of the coal industry than a deep criticism of CCS technology, but titles of that type don’t help the technology gain a true foothold. In a roundabout way, the author also reaches the conclusion that CCS is necessary, but deployment is far too slow.
Technology isn’t the issue holding up the deployment rate; that works just fine. CCS brings together a number of different technologies and processes that have been available in the oil and gas industry for decades and re-purposes them for CO2 capture and storage. Rather, the issue is the economics of doing this; unless there is a clear financial benefit for doing this, it won’t happen. To date that benefit has largely come through enhanced oil recovery (EOR), hence the number of blue coloured projects on the chart. But in a few cases, the benefit has come, at least in part, from a government implemented carbon pricing mechanism.
But a CCS white knight has now appeared on the horizon and it is potentially a game changer. The U.S. Congress has considerably expanded what was a modest and limited tax credit for CCS, into something meaningful that ought to accelerate deployment of the technology. On 9th February, Congress passed and the President signed into law a budget agreement that included language to expand a 2009 tax credit for CO2 capture and storage known as 45Q. The key provisions are that for stored CO2, the tax credit rises to $50 per tonne in 2027, while for use (EOR as well as other uses) the equivalent value is $35. The amounts will be adjusted for inflation after 2026. The credit goes to the facility that captures the CO2 and is available for the first 12 years of operation. There is no cap on the arrangement for the tax credit for CCS facilities put into service after 2018 and for which construction has started before 2024 and eligibility is on a performance basis. In order for the capturing facility to receive the credit, certain monitoring and reporting rules apply to the use and storage of the CO2. Under the previous arrangements for 45Q, the tax credit expired after a total 75 million tonnes of CO2 were stored or used for EOR. The 2009 tax credit was $20 for storage and $10 for use. Besides increasing the amount of the credit and certainty regarding its availability, Congress also made the credit available for air capture and storage of CO2, a nascent technology (just the capture part) that may become a key tool for drawing down CO2 from the atmosphere later in the century.
As a result, the USA now has a $50 per tonne carbon pricing mechanism aimed directly at CCS and even more if removal of CO2 from the atmosphere is involved. While $50 per tonne of CO2 isn’t sufficient for every type of CCS project today, this amount could well be enough to unlock a wave of innovative projects, leading to new infrastructure, storage sites and technology improvements, giving birth to a real industry. Politics aside, this contribution from the United States could be the single most important step that any country takes in helping society reach the goal of the Paris Agreement.
Looking back at my 2017 post on developments in 2016, it becomes clear that the past twelve months have been more consolidation than progress in terms of carbon market development. It also means that the coloured map (below) hasn’t really changed, apart from a slight set-back and the very positive addition of Singapore.
A big story that emerged in 2016 was the prospect of a nationwide emissions trading system in China. Observers waited throughout 2017 for the formal commencement or at least an announcement, but news didn’t come until mid-December of an imminent launch. Rather than an economy wide cap-and-trade system, the government announced that an emissions rate based system would commence in the electricity sector. Harvard’s Rob Stavins has written extensively about it in a recent blog post.
The Chinese carbon market will double the share of global CO2 emissions covered by worldwide carbon-pricing systems to almost 25 percent.
China wasn’t the only country in the news. Also within the Asian economy, Singapore announced the start of a carbon tax based system from 2019, with a draft Bill appearing for consultation during 2017. The tax will be applied on power stations and other large direct emitters which produce more than 25,000 tonnes of carbon dioxide equivalent of greenhouse gases a year. There are currently 30 to 40 of such large emitters, mainly from the petroleum refining, chemicals and semiconductor sectors. The proposed tax will be around S$10-$20 per tonne CO2.
In North America, progress was mixed. The focus continued to be on Canada with the September announcement that Ontario had entered into an agreement to formally link its carbon market with markets in Quebec and California effective January 1, 2018. The Agreement will allow the governments of Ontario, Quebec and California (the Parties) to hold joint auction of greenhouse gas emission allowances and to harmonize regulations and reporting requirements. An important addition to this was the passage of a Bill in California to extend that State’s cap-and-trade system through to 2030. But with the announcement that the US would be leaving the Paris Agreement and that the Administration would be rolling back the Obama Clean Power Plan, progress in the rest of the country was muted.
In Central Asia, the Kazakhstan emissions trading system remained suspended (hence the change from green to orange), but following an announcement by the government, this should revert to operational status in 2018.
South Africa also moved forward slightly, with a further consultation announced on its draft carbon tax legislation.
Here in the EU, the ETS continued, but 2018 saw much needed reforms agreed. The main elements of the agreement are:
The linear reduction factor will be 2.2 % from 2021;
Each year from 2019 to 2023, 24 % of the cumulative surplus of allowances will go to the Market Stability Reserve; from 2023 the allowances held in the reserve above the total number of allowances auctioned during the previous year should be cancelled;
Conditional lowering of the auction share by 3 % of the total quantity if needed, to avoid application of the cross-sectoral correction factor;
Member States may voluntarily cancel allowances to offset national climate and energy policies that reduce the demand.
The EU ETS expanded slightly with the agreement of a link with the Swiss ETS, although it may be some time before this comes into practice. The ratification of the agreement will require the approval of the Council and Parliament, which is expected in early 2018. When parties are technically ready to connect the two systems, they will formally deposit their instruments of ratification. The agreement will enter into force at the start of the following year.
As the year concluded and nations met in Bonn for COP23, it was also clear that carbon pricing, both through taxation or a trading system was being widely considered. This offers considerable hope for the years to come.
As COP23 draws to a close, it offers an opportunity to reflect on the progress made by the UNFCCC and its efforts to address the issue of climate change. This year represents a quarter of a century since the adoption of the Framework Convention and 20 years for the Kyoto Protocol, which was agreed at COP3 in December 1997.
In that time, global emissions have risen by over 50%, hardly a testament to thousands of hours of negotiation, millions of air-miles by COP attendees and many long nights as disagreement erupted. Further, after three years of global emissions seemingly at a plateau, the delegates at COP23 were reminded in stark terms that there is still everything to work for; 2017 emissions are likely to show a 2% rise over 2016. While large uncertainties in the final number remain, emissions in China appear to have risen by some 3.5% (but with arrange of 0.7% to 5.4%).
Although emissions are the truest test of success, bringing them down and ensuring stabilisation of atmospheric carbon dioxide levels was not going to be easy. Nevertheless, the UNFCCC process has persisted and resulted in a world that is slowly mobilizing around the need to act and in many instances is acting. Arguably the process has delivered on several fronts;
The climate issue has grown in profile and almost every international leader talks about it, which in turn builds further interest.
The media is captivated by the subject, although opinions can vary markedly across publications and programmes.
The global fraternity of economists have risen to the challenge, with much written about policy measures and particularly carbon pricing. In the case of the latter, some 20-30% (depending on how China is viewed with its staged implementation) of the global economy now carries a price on carbon dioxide emissions, albeit only around $10 per tonne.
Most national governments and many sub-national governments have greenhouse gas emission based policies active within their respective economies.
Measurement, reporting and verification of greenhouse gas emissions has become a normal activity in much of the world.
Various carbon dioxide based trading units have evolved; from allowances in the EU ETS to project units under the Clean Development Mechanism of the Kyoto Protocol.
Carbon capture and storage has become a commercial technology, although deployment remains limited due to the level of carbon pricing.
A wide range of new power generation, transport and industrial technologies have rapidly evolved in response to the need for zero emission energy services. Significantly, Tesla unveiled its electric semi-trailer in the closing days of COP23.
The above list is not meant to be comprehensive and it could also be argued that some of this is unrelated to the UNFCCC, but without a central focus the lens on climate change would be a very different one. Nevertheless, COP23 highlighted two key issues;
The Paris Agreement did much to minimise the difference between developed and developing countries, with all nations required to submit plans for managing emissions within their economies. But as negotiators began work on the detail of the Paris Agreement ‘rule book’, the issue of common but differentiated responsibilities emerged at many meetings. The core of the issue is that industrial development without fossil fuels, but coal in particular, is still not possible. While much attention is focussed on micro-grids and decentralised renewable electricity in Africa, this is not the same as industrial development. Steel, cement, glass and chemicals require much more; so do the primary means of industrial transport, notably planes, ships and trucks (although Tesla would now argue the point on the last one). As such, emissions in developing countries are still likely to go in one direction, i.e. up!
Financing remains a sticky issue. The Paris Agreement offers various mechanisms and measures to help finance low carbon development in least developed and emerging economies, with a transparency framework to offer insight on progress. As work progressed at COP23 on the modalities surrounding finance, tension grew. One problem here is the definition itself. For many, it means the overall flow of private sector energy investment into developing economies, triggered by national policy, good governance, carbon trade such as that emanating from Article 6 and the attractiveness of projects. But for some, finance is thought of as tangible government to government assistance.
The political sensitivity of both these issues is heightened by the expected departure of the US from the Paris Agreement. It is unlikely that heroics from the US sub-national actors can compensate for that political destabilisation.
These and other issues will need to be resolved in the coming year if the full Paris ‘rule book’ is to be finalised by the end of COP24. In all likelihood, resolution will not be complete, but the process won’t falter either and the ongoing mobilization of global effort will continue. Negotiators will meet again in Bonn around the middle of the year and then in Katowice, Poland for COP24. In the case of the latter, the biggest fight is most likely to be over hotel rooms.