COP28 has come and gone, with the UAE Consensus adopted and now potentially steering the world to a more rapid transition with its ambitious goals for deployment of low-carbon energy technologies. Three key goals of the UAE Consensus are:
Tripling renewable energy capacity globally and doubling the global average annual rate of energy efficiency improvements by 2030;
Accelerating zero- and low-emission technologies, including, inter alia, renewables, nuclear, abatement and removal technologies such as carbon capture and utilization and storage, particularly in hard-to-abate sectors, and low-carbon hydrogen production;
Accelerating the reduction of emissions from road transport on a range of pathways, including through development of infrastructure and rapid deployment of zero and low-emission vehicles;
All of these goals drive the world towards rapid electrification of the energy system, through the direct production of electricity via solar PV and wind, the use of electricity in transport via electric vehicles and the use of electricity to make fuels such as hydrogen. In the Shell Energy Security Scenarios released earlier in the year, both scenarios, namely Sky 2050 and Archipelagos, showed a steep rise in the rate of electrification within the final energy system. Starting from the current annual gain in electricity in final energy of just 0.2% points per year, a rate that has been with us for the best part of a century, it leaps to 0.5% or even 1% point per year. The inflection point in the trend is in the near term, as shown in the chart below.
An electric world is also a world of much higher copper demand, driven by the role that copper plays as such an excellent conductor of electricity. Electric motors have copper winding, transmission lines use copper (although very long-distance transmission can also use aluminium), the infrastructure for building a solar PV farm relies on copper and recharging of electric vehicles requires connections made of copper.
In the Sky 2050 scenario, which sees deployment of renewable energy and electric vehicles on a scale equivalent to the goals set out in the UAE Consensus (see a recent posting by me on this), the scenario team have estimated the impact on global copper production. This is shown in the chart below, along with the trend required for Archipelagos.
Over the last forty years, the mining industry has been adding about 0.3 million tonnes per year, every year, to global copper production, but this isn’t fast enough for either of our scenarios to support their respective transitions. The current rate of production increase would barely support the EV transition in Sky 2050.
An electric car has 70 kgs more copper than a gasoline car, a 200 kW recharger needs 8 kg of copper and solar PV needs 5000 kg copper per MW. So in an accelerated EV 2040 case (Sky 2050) with 1.2 billion EVs on the road, 100 million charging points and 1200 GW of solar PV to supply the new electricity, global copper production would need to increase by 9 Mt p.a. in 17 years. But this takes up all the increase if the future production trend follows history, allowing nothing for the broader use of electricity or all the other applications that already demand copper.
The conclusion is that copper production needs to accelerate and reach a point where more than 1.5 million tonnes of production is added each year, or five times the current annual increase. So we come to a recent story in the Financial Times (FT) where the plight of a copper mine in Panama is discussed. I am not going to discuss the merits or otherwise of this particular mine, but the problems it is facing, and the similar problems faced by companies attempting to open new mines are not uncommon. Copper mining does have an environmental impact, like any extraction industry. Although the industry is well practiced in managing and minimizing the environmental impact, that impact will never be zero and like any industry there may be poorer performers who are singled out by environmentalists and local communities. Such singling out also contributes to the difficulty in establishing a new mine when local communities are concerned that the activity may have a similar impact on them.
Local mining issues also attract global activists, and in this case the FT notes that two prominent global environmental activists used their own networks and leverage to back the local protesters and seek the closure of the mine. Not surprisingly, both these people are strident climate activists as well, seeking a rapid energy transition, which requires abundant supplies of copper.
As noted above, it is not for me to discuss the merits or otherwise of this particular mine, but going forward our society is going to need every tonne of copper it can get its hands on. That shouldn’t mean miners get a free pass, but it does mean that constructive dialogue is essential in order to facilitate existing mining and open new mines. Outright rejection as both the global activists called for in this case isn’t going to help.
Note: Shell Scenarios are not predictions or expectations of what will happen, or what will probably happen. They are not expressions of Shell’s strategy, and they are not Shell’s business plan; they are one of the many inputs used by Shell to stretch thinking whilst making decisions. Read more in the Definitions and Cautionary note. Scenarios are informed by data, constructed using models and contain insights from leading experts in the relevant fields. Ultimately, for all readers, scenarios are intended as an aid to making better decisions. They stretch minds, broaden horizons and explore assumptions.
In the run-up to COP28 and at the conference itself, a key call by some nations and many observers is to include language in the COP decisions to signal the phase out of fossil fuels. While there is no question that the carbon dioxide emissions from the use of fossil fuels and any leakage of natural gas (primarily methane) to the atmosphere is the main cause of the rising global average surface temperature, is it premature for such a call and should phase-out be the all-consuming drive at this stage of the transition? It is of course the obvious answer to the problem of limiting carbon dioxide emissions to a finite amount, but obvious answers aren’t always the right ones.
Given time, there is little doubt that society will move on from thermal combustion as a source of energy, even though it has been the only large-scale source of energy for millennia. Once that happens there will be little need for fossil fuels. We are in an era of rapid technological change and exciting developments in multiple fields of science, with energy production now tending to move into the quantum realm, as information technology has been doing over the past 70 years. Come back in a century or so and the energy world will likely be very different. But that doesn’t help the immediate problem of emissions mitigation.
To better understand the challenge today, Shell uses scenarios to look at nearer term trends and The Energy Security Scenarios released earlier in 2023 are the perfect tool to shed light on the question of fossil fuel phase out. But first, it is important to look at the reality of where we are today. We still live in a society that is utterly dependent on fossil fuels for the delivery of most energy services, such as lighting, heat, mobility, information transfer and powering rotational equipment (pumps, compressors etc.). The production of most goods either includes fossil carbon directly (e.g. plastics, bitumen, cosmetics, medicines etc.) or requires fossil fuels in the production chain. The transition is under way, but the percentage of fossil fuels in the global energy mix has remained at around 80%, even after a quarter century of sustained effort to shift that dependency. However, the pace of change is accelerating. The current global emissions picture for a world powered mainly by fossil fuels is illustrated below.
Phasing out fossil fuels means finding a substitute for the delivery of every single energy service or manufactured item that exists today. Therein lies the problem – the substitutes don’t exist yet, at least not at a scale that matches the delivery potential of fossil fuels. This starts with very humble items, such as the pencil, which I discussed in a recent blog post but extends through to the entire electricity grid. Solar and wind are here to stay, but the complete set of technologies required to power cities with them all the time, overcoming the inherent intermittency of these energy sources, are still in the early stages of development. Similarly, the technologies to make green hydrogen, green ammonia, sustainable aviation fuels, synthetic hydrocarbons using atmospheric carbon dioxide and green hydrogen all exist but operate on a small or in some cases even pilot scale, whereas global oil production alone fills two 330-metre-long super-tankers every hour.
At a recent refinery technology conference I attended, there was real interest in processes to make sustainable aviation fuels, from relatively straightforward hydrotreating of waste oil to complete synthesis of jet fuel from carbon dioxide and hydrogen. Refiners want to do this, and aviation companies are starting to look for these fuels, but the industry is at the beginning of a long-haul development process to completely replace fossil-based aviation fuel. And if our thoughts then turn to electric or even hydrogen powered planes, these are still on the drawing board. Development and widespread deployment of new energy technologies on a global scale is measured in decades, not in years.
When the Shell scenario team developed The Energy Security Scenarios we thought hard about these timelines for change and considerable research went into understanding when technologies might emerge at scale. Two transition scenarios are presented, Sky 2050 which is largely devoid of headwinds and builds on global mutual interest, and Archipelagos which sees national self interest prevail and act as a drag on the energy transition when compared to Sky 2050. In Sky 2050 which achieves net-zero emissions globally by 2050, fossil fuel use is still commonplace in that year, albeit reduced by nearly two-thirds when compared to today. Substitutes are being found and alternative services delivered, but not fast enough to phase out fossil fuels on a timeline that matches the need for net-zero emissions.
The short answer is that net-zero emissions should take precedence over fossil fuel phase out because it can be achieved more readily and in a shorter time frame. But even net-zero emissions in the shorter term, such as by 2050, will require not just considerable fossil fuel substitution effort but also considerable use of every available carbon removal mechanism. In the Sky 2050 illustration below, remaining emissions (fossil energy and cement) of 8.4 Gt per year in 2050, even after the direct use of carbon capture and storage (CCS), is balanced by carbon removals delivered mainly through land use change, some direct air capture with geological storage (DACCS) and bioenergy production linked with geological storage (BECCS). But as noted, there has been considerable substitution away from fossil fuels as an energy source when compared to now.
A strategy that builds on the notion that all fossil fuel use can be ended by 2050 is likely to fail, whereas one that focuses on net-zero and embraces the seeming ambiguity and apparent messiness of such a solution can succeed. But it is just an interim step towards a world where fossil fuel use has largely ended. By late in the century in Sky 2050, fossil fuel use is a tiny fraction of today and most of that remaining use is as a ready source of carbon for making things, like plastic products. The fossil fuel use for combustion processes is in limited legacy applications where facilities that were built years earlier with CCS are still operating. But direct use of CCS has declined considerably compared to 2050 as industrial concerns use hydrogen, bioenergy and electricity to power their facilities.
Fossil fuel phase-out is a handy catch phrase that attracts interest and seemingly presents a solution to rising global temperatures, but it may not be the best immediate solution. A focus on net-zero and the development of policy instruments to encourage a balance between remaining emissions and various sink technologies and land use practices is where we need to be, but such a framework is proving hard to realize. Nevertheless, the USA is doing it now with a pioneering incentive scheme aimed at both new energy technologies and carbon emissions management; perhaps a trillion US dollars will flow into this full range of transition technologies. And in Australia a carbon farming initiative (CFI) has been running for some years which incentivizes farmers to maximize land carbon stock as an important output from their agricultural activities, such as growing wheat and raising cattle.
As COP28 gets underway, the fossil fuel phase out discussion may get very heated, and while it is an important discussion to be had, it should not become a distraction to the shorter-term goal of net-zero emissions, which will require a major emphasis on the development of carbon removal practices and technologies.
Note: Shell Scenarios are not predictions or expectations of what will happen, or what will probably happen. They are not expressions of Shell’s strategy, and they are not Shell’s business plan; they are one of the many inputs used by Shell to stretch thinking whilst making decisions. Read more in the Definitions and Cautionary note. Scenarios are informed by data, constructed using models and contain insights from leading experts in the relevant fields. Ultimately, for all readers, scenarios are intended as an aid to making better decisions. They stretch minds, broaden horizons and explore assumptions.
I recently attended an emission trading conference in Paris and like many such events in the EU now, one of the first items on the agenda (and in this case it was the first) was a presentation and discussion on the US Inflation Reduction Act (IRA). The fact that the IRA isn’t an emissions trading system didn’t matter. The IRA has upended the climate discussion in the EU in that projects are happening in the US, and change is underway, while a key green technology sector like the EU wind industry is facing headwinds.
After years of attempting to implement carbon pricing but finding it to be politically impossible to do so, the USA has taken a very different track to the EU where the flagship policy is the EU Emissions Trading System (EU ETS) and its carbon price, currently around €80 per tonne CO2. The IRA offers tax credits across a range of technologies, from electric vehicles to direct air capture (DAC), with the benefits for the latter of up to $180 per tonne CO2 when geological storage is involved (DACCS). Earlier this year Goldman Sachs estimated that the IRA could deliver as much as $1.2 trillion of incentives by 2032 and spur $2.9 trillion of cumulative investment opportunity across sectors for the re-invention of U.S. energy system. Little wonder the IRA features at the top of a climate change conference agenda in the EU.
Meanwhile, presentations about the EU ETS at the same conference pointed to a system with growing ideological constraints. Top of the list is the near absence of a carbon removals framework such that this key set of technologies can start featuring in EU ETS driven investment decisions. Rather, it almost felt as if the EU is just expecting emissions to fall to zero by the early 2040s, thus avoiding any major need for removals. It isn’t clear how this might happen in practice and certainly none of the scenario work done in Shell points to anything even close to such an outcome. Even in our most ambitious scenario, Sky 2050, the global energy system will remain bound to fossil fuel use right through the middle of the century and beyond, albeit sharply decreasing, with the end of the fossil fuel era not even in sight until the 2080s. As such, carbon removal technologies like direct air capture with storage (DACCS) need momentum today, which is happening in the US under the IRA, but the equivalent investment in Europe is essentially zero.
The different approaches in the EU and USA are highlighted in our Energy Security Scenarios, released a few months ago, through the use of behavioural archetypes. The EU is a Green Dream region, meaning that they are ideologically attached to removing fossil fuels from the energy system as fast as possible. By contrast, the USA, along with other major resource countries, are characterised by the tagline Innovation Wins, which means that they will tackle the issues in the energy system through innovation, but with pragmatism prevailing. If that means using fossil fuels in some applications and developing DACCS to manage emissions, then so be it. No ideology, just money and science.
One of the strengths of the World Energy Model (WEM) that sits behind our scenarios is the ability to drill down into single countries, technologies in countries or sectors in countries. And I have done just that for the USA with the WEM to illustrate the pathways for our two new scenarios, Sky 2050 and Archipelagos. These are stories that are full of technology and innovation, with rapid change resulting.
Firstly, just a reminder of the two scenarios:
Archipelagos depicts a global narrative of shifting political winds driving the transition away from fossil fuels. Despite encountering challenges, the pace of the transition accelerates due to heightened security concerns and competition. This scenario envisions a world where energy security takes precedence over emission management.
Sky 2050 explores a world in which long-term climate security is the primary anchor. Society rapidly moves towards net-zero emissions but doing so requires major interventions from policymakers in the energy system.
The scenario timeline for the USA through to 2060 is shown below, built by extracting multiple different views of the US energy system from the WEM database.
A defining feature is that even in the slower transition, Archipelagos, the USA is closing in on net-zero emissions by 2060, years before other countries. This is linked in part to the IRA today, which establishes momentum behind both transformative energy technologies and CCS, although in the case of the latter not on the scale seen in Sky 2050. One key difference between the scenarios is the complete disappearance of the DAC industry in Archipelagos, whereas it booms in Sky 2050 once high initial costs come down. The emergence of DAC in Sky 2050 also gives rise to a synthetic fuel industry in the USA, which tempers hydrogen use for aviation later in the century compared to Archipelagos.
In Sky 2050 net-zero emissions is reached in the late 2040s in the USA, before the current 2050 goal.
But both scenarios for the USA see an all-electric passenger car market, hydrogen road freight, electric airplanes, expanding biofuel production, hydrogen jet travel (not shown above for Archipelagos but from 2050), solar and wind expansion and of course falling emissions.
In the USA, at least, innovation does win!
Note: Shell Scenarios are not predictions or expectations of what will happen, or what will probably happen. They are not expressions of Shell’s strategy, and they are not Shell’s business plan; they are one of the many inputs used by Shell to stretch thinking whilst making decisions. Read more in the Definitions and Cautionary note. Scenarios are informed by data, constructed using models and contain insights from leading experts in the relevant fields. Ultimately, for all readers, scenarios are intended as an aid to making better decisions. They stretch minds, broaden horizons and explore assumptions.
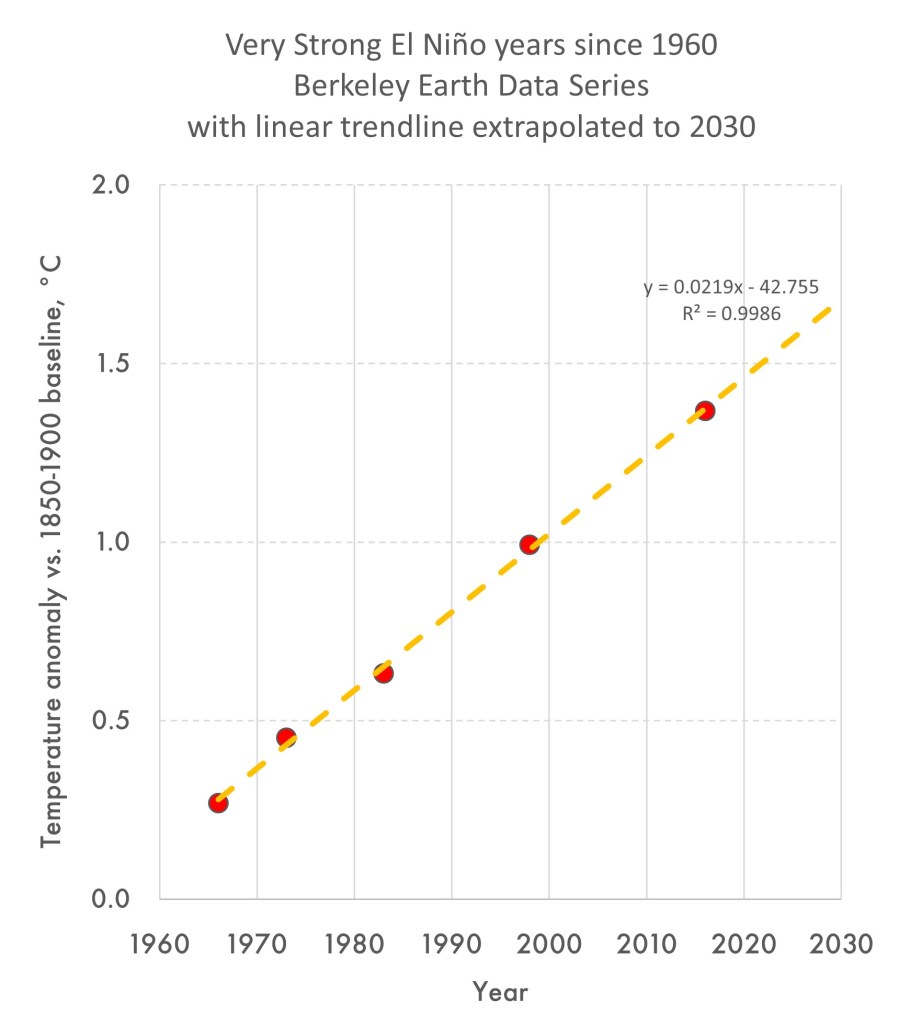
In mid-2019 I posted a global temperature analysis that showed how we might have a first 1.5°C year sooner than many were imagining. This built on a 2016 story I posted. My 2016 analysis was catalysed by the significant jump in temperature the world experienced that year as a very strong El Niño event took hold. In February of 2016 the world had experienced the first month in which the global temperature anomaly was over 1.5°C higher than pre-industrial times (represented by the 1850-1900 baseline and as reported by NASA/GISS). As the El Niño subsided the elevated warming also reduced, but it left me thinking that the next strong El Niño might deliver a first 1.5°C year rather than just a single month. With El Niño emerging again in 2023, are we now at that point?
In recent weeks and months we have seen a number of media stories about the global temperature reaching unprecedented levels with societal alarm bells ringing about the situation. The current El Niño event started in about April of this year with the Oceanic Nino Index (ONI) crossing from negative (La Niña conditions) to positive and rising since then. It is now at 1.3° and continuing to rise, but is not yet at the point of being a Strong or Very Strong event; the ONI has to be around 2.0° for that to be declared. According to a NOAA report on October 16th El Niño is favoured through to Northern Hemisphere spring 2024, with chances exceeding 95% through January-March 2024. Thereafter, chances of El Niño gradually decrease, with a possible return of ENSO-neutral (El Niño Southern Oscillation) in May-July 2024. So could 2023 be a 1.5°C year on the back of this?
Here is what we know.
The underlying global temperature anomaly (i.e. global average surface temperature vs. 1850-1900) is rising at about 0.2°C per decade (in fact 0.0197 per year from 1975 to 2023 according to the most recent Berkeley Earth data) as more and more CO2 is added to the atmosphere.
The recorded temperature anomaly (which the Paris Agreement is attempting to keep below 1.5°C) for a specific year is highly variable depending on annual climatic shifts, most notable being the El Niño Southern Oscillation (ENSO).
ENSO has two distinct phases, El Niño when the mid-Pacific warms and we tend to see higher global temperatures and La Niña when there is cooling and we tend to see lower global temperatures.
We have recently moved from a La Niña condition to an El Niño condition and that condition is growing.
Based on years in the last half century when we had a similarly strong to very strong El Niño (1966, 1973, 1983, 1998, 2016) and a consequent anomalously high global average surface temperature, we can see that in the near term if we move into Strong El Niño conditions, we will likely see the first 1.5°C year. In the chart below, this would be any time after about 2021.
While 2023 isn’t a Strong El Niño year yet, we are heading in that direction (but that doesn’t mean we get there). The ONI continues to rise and for each year after 2021, the height that it needs to rise to for a first 1.5°C year will become progressively lower due to the underlying warming trend.
With all that in mind, what can we say about the temperature so far this year and the possibility of 2023 exceeding 1.5°?
If we draw a chart that removes the underlying 0.2°C per decade warming, then we are left with the variation in annual temperature as a function of other factors, including the ONI. The latter typically varies between -2° (strong La Niña) to +2° (strong El Niño).
The chart below shows two annual trends. At the bottom in grey is the Oceanic Niño Index, which is now at about 1.3°, but during the Very Strong El Niño of 2015/2016 reached 2.6°. The orange line at the top is the ‘warming removed’ variation in global average surface temperature variation vs. 1850-1900. This appears to be just a very noisy chart, but the trend through it is flat which is important (meaning that the warming has been cleanly removed).
Eyeballing the chart might lead to the view that the variation is more positive in El Niño years and more negative in La Niña years, which it should be given this is a shorter term cooling and warming cycle. However, plotting the ONI vs. the anomaly variation (see the chart in blue below) doesn’t yield a strong trend. A regression of the data points with the intercept at zero gives a slope of around 0.1°C (actually 0.0731) of global temperature variation for each point of Oceanic Niño Index change. But a visual inspection of the data range (orange dotted lines) perhaps points to something more aggressive, possibly around 0.2°C for each point of Oceanic Niño variation. A more detailed statistical analysis of this is almost certainly required, which is beyond my university statistics. This may be challenging though as the data includes all possible reasons for short term variations, besides the ENSO. There’s volcanoes (e.g. Mt. Pinatubo in 1991), solar variances, sea ice cycles and perhaps even events like very major forest fires, to name a few.
If we were to assume a factor of around 0.15°C warming for each point in the ONI, then the temperature excursions seen over recent months are not surprising (although the very last month of the trend has really concerned the science community). Using the Berkeley Earth monthly time series, the monthly average temperature anomaly in 2018 was 1.2°C, in a year when ONI averaged very close to zero, i.e. neutral. Compared to 2018, then today which is five years later we would be at:
1.2 (2018 data) + 0.1 (underlying warming over five years) + 0.2 (1.3° * 0.15, current El Niño impact) = 1.5°C
The calculation above uses the current ONI of 1.3°, which is above the year to date average of around 0.5°, but it does show that we are in 1.5°C territory for 2023, which is concerning. There’s also a great deal of annual variability in the numbers. For example, starting with 2020 data (instead of 2018) when ONI averaged -0.4 (i.e. cooler La Niña period), but with the Berkeley monthly average anomaly at 1.35°C, then the same calculation comes out above 1.5°C.
Nevertheless, please note that the above analysis uses only the Berkeley Earth Data Set, which is one of several. In the World Meteorological Organisation (WMO) State of the Global Climate 2022 Report they included six datasets, of which Berkeley was one. Further, the IPCC use a ten year moving average temperature to assess the longer term state of the climate, which is still tracking well below 1.5°C but clearly rising. And if the world was back in a La Niña phase by 2025 the temperature in that year would likely be back below 1.5°C as well. As such, the recent temperature data and the possibility of 2023 or 2024 crossing the 1.5°C threshold serve as an important warning for the future.
As has been the case in recent COPs, we may see the WMO announce a final estimate for 2023 at COP28, before the complete data set is available in early 2024. Should an announcement point to 2023 being the first 1.5°C year it will certainly focus the minds of the negotiators in attendance as they contemplate the Global Stock Take and the COP28 declaration of action, expected to be finalised on December 12th.
Many years ago the well know economist Milton Friedman made a short film about pencils that continues to resonate today. While the film can be interpreted as simply a defence for capitalism, which Friedman was famous for defending, it nevertheless does make a good point about the complexity of the world we live in. The manufacture of an item as simple as a pencil requires such a wide range of resources, skills, machines and knowledge that no one person could easily craft a pencil as refined as the product we can buy for not very much money in a local shop or online.
The steps to make a pencil are many, but at least the basics are outlined in this short video.
What is missing however, from both Friedman’s and the manufacturing video, is any reference to the energy (and hydrocarbon materials) required and where that energy (and hydrocarbons) might come from. There’s almost an underlying assumption that the energy is just there, available in abundance. But the complexity of the system to deliver the pencil relies entirely on a complex energy system that we are collectively now trying to change. Unfortunately a rhetoric has emerged that this change will be both simple and quick, yet neither are true. The energy system that delivered the pencil took over 150 years to evolve, and it continues to do so even without the more recent changes related to renewable energy. But the pencil that emerges has CO2 emissions related both directly and indirectly to its manufacture, largely because of the energy system used to power the manufacturing steps, which of course is why that energy system needs to change. However, that energy system is only there because we need pencils, and other manufactured goods and energy services.
Within the pencil the most visible material is wood, which is often cedar as noted in the above video. While this is entirely natural, sourcing it requires considerable amounts of energy to fell trees, transport the logs, cut and shape the wood, then move the final wood pieces to the pencil manufacturing plant. While some of this energy is electricity, there is considerable use of diesel for transport.
The pencil lead is noted as being a mixture of graphite and clay, baked at over 800°C in a furnace. The world’s largest graphite producers are China, Madagascar, Mozambique and Brazil, so there will almost always be considerable transport involved, probably by sea using marine fuel oil or marine diesel. As well as the energy used in the mining and refining process, baking the graphite with clay will likely require natural gas. But there is also synthetic graphite as an alternative. Synthetic graphite is produced through a complex process of baking petroleum coke at very high temperatures. Synthetic graphite can have a purity of over 99% carbon, and it is used in manufactured products where extremely pure material is required, which includes pencils.
Then there is the glue. Modern wood glues are largely synthetic, made from petroleum-derived plastics like polyvinyl acetate (PVA). Almost all vinyl acetate monomer is now produced via the vapor-phase reaction of ethylene and acetic acid over a noble-metal catalyst, usually palladium. The reaction is typically carried out at 175–200 ºC and 5–9 bar pressure. The ethylene might come from an ethane cracker, such as the Shell facility in Pennsylvania which uses the ethane in natural gas to produce ethylene for the further manufacture of chemicals and plastics (like polyethylene). But along the way considerable energy is required for the synthesis process, also coming from fuels such as natural gas, but some electricity as well which could be sourced renewably.
The ferrule at the end of the pencil is made of aluminium, which is also an energy intensive mining, refining, electrolysis based process with multiple transport steps. Much of this requires liquid fuels and natural gas, although the electrolysis step often uses renewable electricity in places of abundance, like Iceland. However, the electrolysis currently requires graphite in the anode and cathode, with the anode being consumed during the electrolysis process (producing CO2) and needing constant replacement.
Finally there is the pencil eraser, which may be made from natural rubber sourced from a country such as Malaysia and transported on ships using marine fuels. But much of the global rubber industry is now based on synthetic rubber, which derives from yet another complex chemical process. Synthetic rubber production begins with the refining of oil or other hydrocarbons. During the refining process, naphtha is produced. The naphtha is then used to produce monomers such as styrene and isoprene, which are necessary for the production of synthetic rubber. The most common synthetic rubber is styrene-butadiene rubber (SBR) derived from the copolymerization of styrene and 1,3-butadiene.
The paint used to decorate the pencil may also have various components in it derived from crude oil and the manufacturing process will require energy as well.
So far I have only discussed the pencil itself, but there is an enormous dependency on milling machines, cutting devices, refineries, pipes, ships, trucks, tanks, storage depots, roads, trains and various other pieces of infrastructure, many of which are made of steel and therefore require iron ore mining and coal fired smelting for production. And all the roads used for transport, including the final delivery of the pencil to a shop or to a home to fulfil an online order, are largely made of bitumen, derived from crude oil.
While the pencil itself is a relatively simple implement, as Milton Friedman points out it requires the cooperation of thousands of people to produce. But it also requires the operation of hundreds of different mining, chemical and energy production facilities, not to mention factories making machines, trucks, ships and other pieces of equipment. All of these run on energy and most will use coal, oil or natural gas to do so. Only a fraction have been fully converted to renewable power, although many more may use some renewable energy as part of the electricity the facility uses or the final delivery may be in an electric van. Some of the processes required to ultimately make a pencil may not yet have an alternative that doesn’t use oil or natural gas as a feedstock for the carbon in the final product.
The job ahead is to convert all of these, or rebuild them, to facilities that don’t use coal, oil products or natural gas for energy. In our recently released Sky 2050 scenario, the near 80 years between now and the end of the century sees a world largely achieve this, but at a pace of change that is unprecedented. In the Sky 2050 scenario, in the year 2100, fossil fuels make up less than 5% of primary energy demand, with a good portion of that going into products like pencils rather than being used for energy. But this is not the case at all in 2050, when fossil fuels are still about a third of primary energy and therefore emissions from their use must be managed through land use mechanisms and geological storage of CO2. This is what net zero is all about, since zero use of fossil energy is much more a 22nd century possibility than it is a 21st century reality.
Note: Shell Scenarios are not predictions or expectations of what will happen, or what will probably happen. They are not expressions of Shell’s strategy, and they are not Shell’s business plan; they are one of the many inputs used by Shell to stretch thinking whilst making decisions. Read more in the Definitions and Cautionary note. Scenarios are informed by data, constructed using models and contain insights from leading experts in the relevant fields. Ultimately, for all readers, scenarios are intended as an aid to making better decisions. They stretch minds, broaden horizons and explore assumptions.
A guest post by my scenario team colleagues Thomas Akkerhuis and Georgios Bonias
In a few days, leaders from the world’s largest economies will gather in India for the 2023 G20 summit. The G20 Presidency has included Green Development as one of the main themes of the summit with a specific mention on ‘ensuring just energy transitions for developing countries’. At the same time, given the volatility and uncertainty in energy markets, many countries are looking to secure their own energy sources, with fossil fuel extraction as part of plan. Looking forwards, how might the emerging and least developed parts of the global economy respond to the call for green development, net-zero emissions and much lower use of fossil fuels? Looking back, it’s important not to forget that today’s developed economies largely sprang to life on the back of coal, then oil, and later naturl gas, with no CO2 emission constraints to consider.
A few months ago, Shell published The Energy Security Scenarios, which explore two different pathways for the energy transition, driven by the global shift towards a security mindset.
Sky 2050 – a very rapid transition where global climate security overcomes shorter-term national concerns.
Archipelagos – where national security concerns create ongoing headwinds in an otherwise rapid transition.
To help explore how different countries might navigate through the transition, four different archetypes were identified, with nations behaving in similar ways when they share similar vulnerabilities to energy supply disruption and energy price volatility. In both scenarios, the security mindset leads to aggressively competitive, rather than co-operative, decarbonisation.
The archetypes are:
Green Dream – which can be observed in the European Union. The EU’s wealth enables it to deal with energy price volatility, but its advanced economies and depleted oil and gas resources make it highly vulnerable to energy supply failures. These countries seek security by driving hard to end the use of fossil fuels.
Innovation Wins – which can be seen in countries like the USA and major energy resource holders like the United Arab Emirates. These countries are often self-sufficient in energy so are not vulnerable to supply failures, but their political systems are exposed to swings in the energy price. These countries do not feel so threatened in the short term, but invest heavily in innovation and infrastructure as longer-term solutions to their energy needs and the needs of their energy customers.
Great Wall of Change – which is mainly relevant to China. China is insulated from both supply and price concerns by several factors: the size of its economy, its large coal reserves, and the scale of the investments it is making in its own energy supply and infrastructure. China takes a cautious approach, aware of the need to move away from coal – by far the most emissions-intensive fossil fuel – and carefully monitoring global energy market developments. It looks to use its manufacturing strength to grow its position as a global low-carbon energy powerhouse.
Surfers – which subdivides into Emergent Surfers, like India and Brazil, and Rising Surfers being the world’s least developed economies. The latter includes most countries from the African continent, and they are more focused on establishing the basic foundations for development, such as infrastructure. Surfers countries do not produce significant amounts of energy and so they are vulnerable to both energy supply disruption and price swings. Emergent Surfers quickly adopt new technologies while Rising Surfers focus more on access to energy. Surfers seek out partnerships and try to ride the waves of opportunity created by other archetype groups.
We have used the archetypes to explore how people, wealth and energy are distributed. The Green Dream and Innovation Wins archetypes currently account for 23% of the global population but almost 60% of global energy demand and 63% of the global GDP. On the other hand, Surfers countries make up more than half of the world population but only about a third of the global energy demand and GDP.
The skewness of GDP distribution, favouring Innovation Wins and Green Dream, comes at a cost, being the large contribution to global anthropogenic CO2 emissions that these countries have made. Based on our analysis of data from 1850 onwards, the cumulative CO2 emissions for countries in these archetypes are more than 600 tonnes per current inhabitant, while for the Great Wall of Change archetype they are about 140 tonnes. For Emergent Surfers countries the number is just above 100 tonnes of CO2 and for Rising Surfers around 30 tonnes.
The share of the different archetypes in annual CO2 emissions has been going through significant changes in recent decades, reflecting the changing dynamics in the global economy. In practice, CO2 shares are even more skewed. For example, China’s emissions are partially due to product demand in Innovation Wins and Green Dream. The same is true for land use change emissions, where Brazilian deforestation is partially a result of global food demand.
Given that countries in the Great Wall of Change and particularly in the Surfers archetypes are expected to have strong economic growth in the coming years and decades, we looked at the CO2 profiles that these countries will need to have, according to the Sky 2050 scenario, in order for the world to be at NZE by 2050. Historical data for all archetypes are shown in grey lines and the possible future pathways, based on the Sky 2050 scenario analysis, are shown in colour.
The key message coming from this analysis is that developing countries will need to achieve their projected economic growth following pathways of much lower CO2 emissions than today’s developed countries did over the last 100 years. If countries in the Great Wall of Change and Surfers archetypes were to follow similar CO2 emissions pathways as the Green Dream and Innovation Wins countries when reaching similar levels of GDP/capita, then global CO2 emissions at 2050 would be close to 80 Gt per year, which is double of today’s levels, instead of NZE as is required to stop global warming. Much lower CO2 pathways can be achieved in three ways:
Use fewer energy services compared to developed economies at a similar level of income.
Use energy services that consume less energy (higher efficiency).
Use energy services that make use of cleaner energy (lower fossil fuel share)
The first is not a viable option and therefore we do not make use of it. However, some economies may appear to follow this pathway, but in reality a modal shift is taking place. For example, shared ownership of vehicles has never been established at scale in the USA or EU, but it could emerge in parts of Africa. However, this doesn’t mean that people travel less. Clean electricity will address both the second and third points: electrified energy services are often much more energy efficient, and when the electricity is clean, that brings the additional benefit of emissions reduction. For the non-electrified parts of the energy system, low life-cycle emission hydrocarbons (such as biofuels) and hydrogen can still address the third point.
So what happens in the two scenarios?
Sky 2050 must, by necessity, embrace an energy system leapfrog for developing counties simply to reach net-zero globally by 2050. But despite national security interests prevailing in Archipelagos, broadly the same trend is followed. For the Rising Surfers group in Archipelagos, per capita fossil fuel use never gets to the levels seen in any of the other archetypes due to the growing availability and falling cost of alternative energy technologies. For example, as Rising Surfers develop in Archipelagos:
Coal never dominates the electricity sector as it has in most other developed regions. This is further supported by the high potential for solar energy production that many countries in the Rising Surfers group have.
The use of hydrocarbon fuels for mobility in Rising Surfers will peak far below the Green Dream / Innovation Wins levels.
The buildings sector in Rising Surfers will switch directly from traditional biomass to clean electricity – skipping phases of coal-fired power and gas-fired boilers.
In theory, the transition is possible given the progress in technology and the lower carbon energy options which are becoming available nowadays. Rising Surfers are well positioned in some important ways. For example, Africa, having less than 30% of the global land area, has an estimated 58% of the global resource potential for solar energy. This is a useful contrast with Innovations Wins and Green Dream who have built their wealth on traditional sources of energy. In Sky 2050, by 2100, almost 30% of global direct air capture capacity is located in these countries, potentially generating huge revenue through removals trade under Article 6 of the Paris Agreement. From an energy demand perspective, their climate will eliminate an important portion of heating demand in buildings sectors which is often provided by direct combustion of natural gas. By contrast, air cooling is already an electricity based energy service. Efficiency will grow due to urbanization trends, with over 80% of the Rising Surfers’ population living in cities in the second half of the century (vs. less than half today).
But here will also be barriers. Although some green technologies are cheaper than their fossil fuel counterparts, many are not, or require significant upfront investment. Building an electricity grid that can handle increasing electrification and the intermittency of solar will be a challenge. It will be critical and fair to have mechanisms through which developing countries can be supported in this alternative pathway and the new energy technologies made widely available as quickly as possible. This will be one of the many challenges faced by the G20 when they meet in India. The world’s ambition to reach net zero emissions by 2050 will depend on it.
Note: Shell Scenarios are not predictions or expectations of what will happen, or what will probably happen. They are not expressions of Shell’s strategy, and they are not Shell’s business plan; they are one of the many inputs used by Shell to stretch thinking whilst making decisions. Read more in the Definitions and Cautionary note. Scenarios are informed by data, constructed using models and contain insights from leading experts in the relevant fields. Ultimately, for all readers, scenarios are intended as an aid to making better decisions. They stretch minds, broaden horizons and explore assumptions.
For the people in a scenario team, it’s always exciting when something that you have discussed in your work suddenly starts to appear. It’s even more exciting when it happens in the company that you work for. So it is with direct air capture (DAC). Last week Shell announced it has taken the decision to build a DAC industrial-scale demonstration unit at the Shell Technology Center Houston (STCH), in the USA. With a targeted start-up in 2025, the company aims to prove the technical viability of its in-house developed solid sorbent technology.
Shell’s Direct Air Capture technology discussed
The Shell announcement is but one of several DAC announcements in recent months, with many of the projects in the USA where the Inflation Reduction Act (IRA) is pumping over a billion dollars into this nascent technology. Also last week The U.S. Department of Energy (DOE) announced that DAC projects in Texas and Louisiana to remove more than 2 million tonnes of carbon dioxide per year from the atmosphere will get over $1 billion in federal grants. Two major projects the DOE selected are Project Cypress in Louisiana, run by Battelle, Climeworks Corporation and Heirloom Carbon Technologies; and the South Texas DAC Hub in Kleberg County, Texas, proposed by Occidental Petroleum’s subsidiary 1PointFive and partners Carbon Engineering Ltd (whom Oxy have subsequently announced they are acquiring) and Worley.
I have written about DAC in several posts, but it’s worth revisiting this in the context of these announcements and through the lens of The Energy Security Scenarios. Two scenario stories are presented, Sky 2050 and Archipelagos. They explore the tension that now exists between what world leaders promise on climate change at events such as COP26 in Glasgow and the reality those same leaders face when near term energy system disruption occurs, and immediate decisions must be taken to address the situation.
Archipelagos depicts a global narrative of shifting political winds driving the transition away from fossil fuels. Despite encountering challenges, the pace of the transition accelerates due to heightened security concerns and competition. This scenario envisions a world where energy security takes precedence over emission management.
Sky 2050 explores a world in which long-term climate security is the primary anchor. Society rapidly moves towards net-zero emissions but doing so requires major interventions from policymakers in the energy system.
In the Archipelagos story there is no DAC, at least not until the tail end of the century when it just starts to emerge. This is a story where current efforts come to nothing as other issues take priority – although not without consequence. But in Sky 2050 the technology flourishes and by 2100 it has made a material difference to the temperature outcome. However, it’s not a simple journey. Today there is a lot of discussion around DAC, but it remains a nascent and relatively expensive technology with capture costs of several hundred dollars per tonne of CO2, although estimates and statements of cost vary widely. The goal is to progressively bring down the cost, perhaps to around $100 per tonne CO2, but it is nowhere near this level today. So in Sky 2050, even though DAC emerges, nothing truly material happens until 2040, still over 15 years away. This is because new technologies in the energy sector typically take a generation (20+ years) to mature before material change is visible. DAC first appeared at least a decade ago, if not more, and is now only just being turned into the first larger scale projects. Compare this to solar PV, it first appeared in the late 1950s, with the first commercial power generation installation (6 MW) in 1983. In 2022 solar PV produced about 5% of global electricity, 40 years after the first project.
In Sky 2050 the first material appearance of DAC (5 million tonnes per annum globally) is in 2040 and this is for fuel synthesis, not for geological storage and therefore permanent removal. Presumably this is where the business model lies, despite the economic pull from the IRA. Airlines are likely to create early demand for sustainable synthetic hydrocarbon fuel (replacing crude oil derived Jet A-1) due to their need to transition towards net-zero emissions by 2050, but without a replacement propulsion technology. But by the mid-2040s DAC with geological storage (DACCS) has appeared and by 2050 is triple that for synthesis, with the two combined at over 500 million tonnes per annum. While the scale of DAC by 2050 is important at 500 million tonnes, this isn’t the technology that delivers NZE in 2050. It just isn’t big enough by then. NZE in 2050 comes through multiple other channels, with conventional CCS and land use change being the two big differentiators in a world that still uses considerable amounts of fossil fuel (albeit reduced by nearly two thirds from current levels).
Nevertheless, the scale up of CCS will be invaluable for DACCS, laying the groundwork by building the infrastructure for the transport and storage of CO2. At the moment, the focus is understandably on the capture side of DACCS, but it would be a major lost opportunity if the transport and storage infrastructure was not ready to take advantage of large scale DACCS when it does arrive.
Where DACCS has a major role to play is in the second half of the century. By 2100 this is an industry that has grown from nothing today to 6.6 billion tonnes of CO2 per year. In gas volume terms that’s like 2.2 billion tonnes of natural gas, which means that the CO2 gas handling infrastructure for DACCS in 2100 is getting towards the scale of global natural gas infrastructure today. From 2050 to 2100 the DACCS industry removes over 150 Gt of CO2 from the atmosphere, equivalent to 0.1°C of warming. This is an important contributor to the reduction in warming in Sky 2050 from 1.67°C (peak) to 1.22°C (in 2100).
And with 5.4 Gt of DACCS capacity in place, warming could conceivably be reduced by about another 0.15°C every 50 years after 2100. Direct air capture (and its combination with geological storage) is a technology for the longer term future, even though it will begin to bring more immediate benefits in the fuel synthesis industry in the shorter to medium term. But to build an industry that eventually handles CO2 on the scale we imagine in Sky 2050 by the end of this century, means starting now. While detractors have been quick to criticise DAC, in part because of a view that resources need to be focussed elsewhere today, fully addressing the climate issue means adopting a range of technologies and pursuing them relentlessly. The emissions problem we have is only partly solved by renewable energy, with the full solution coming when we can combine new energy sources with the management of CO2 from legacy energy sources. That is where DAC plays a critical role.
Note: Shell Scenarios are not predictions or expectations of what will happen, or what will probably happen. They are not expressions of Shell’s strategy, and they are not Shell’s business plan; they are one of the many inputs used by Shell to stretch thinking whilst making decisions. Read more in the Definitions and Cautionary note. Scenarios are informed by data, constructed using models and contain insights from leading experts in the relevant fields. Ultimately, for all readers, scenarios are intended as an aid to making better decisions. They stretch minds, broaden horizons and explore assumptions.
One of the features of an upcoming COP is that the months prior often bring with them a slew of proposals for new global targets and initiatives. This year is no different, perhaps also driven by the extreme heat and precipitation that has been challenging the Northern Hemisphere. In July, COP 28 President, Dr. Sultan al-Jaber, put forward a proposed COP28 action plan in a letter to the Parties. Along with a number of calls for increasingly rapid transformation and improved financing for developing countries, the plan includes the following three specific energy system targets which were also widely reported on in the media:
Reach a global tripling of renewables capacity by 2030.
Doubling of the average global rate of energy efficiency improvements by 2030.
A dramatic scale up of new low-carbon hydrogen production and decarbonization of existing hydrogen production to reach an overall doubling of hydrogen production.
The plan also includes emission reduction targets for the oil and gas industry to achieve by 2030 and includes a call to transform heavy-emitting sectors, including scaling up use of low-carbon hydrogen, carbon capture and storage, and carbon dioxide removal, aligned with science. However, no specific targets are included for these heavy-emitting sectors. This all represents quite a formidable ambition, but to put these three energy system targets into context the recent Shell Energy Security Scenarios provide a useful backdrop.
The scenarios comprise two different stories for the decades ahead, but both are built from the security-focused world in which we currently find ourselves. In Sky 2050, the troubles of the 2020s give way to intense global competition in a race to gain market share in the delivery of clean energy systems. Mutual interest prevails and net-zero emissions is achieved in 2050. But in the second scenario, Archipelagos, distrust, self-interest and security concerns prevail. Although a rapid transition takes place and emissions fall throughout the century, the net-zero goal isn’t realised until early in the 22nd century. Nevertheless, warming is limited to 2.2°C above the 1850-1900 baseline period.
The Energy Security Scenarios data shows global renewable capacity at around 3,500 GW in 2023, implying a 2030 goal of around 10,000 GW. The 2023 capacity is comprised of 1,200 GW hydroelectricity, 1,200 GW solar PV (commercial at 800 GW and rooftop at 400 GW) and 1,100 GW wind power. There’s also 100 GW of commercial biomass burning, but not everyone considers this as renewable energy. While hydro and biomass show only modest increases over the remainder of this decade, wind and solar increase substantially in both scenarios. In 2023, solar PV looks to be increasing by about 300 GW and wind by 100 GW, although some of this may be related to COVID delayed projects now coming online. With seven full years before the end of 2030, delivery at these scales could mean some 3,300 GW of solar in total and 1800 GW of wind in 2030, but this is well below the goal of some 10,000 GW even with hydro and biomass included. The deployment rate needs to substantially increase and that is exactly what is happening in Sky 2050.
In Sky 2050 and Archipelagos, the growth to 2035 is shown below.
In Sky 2050 the goal is reached in 2030 but, in Archipelagos, it’s not until about 2035. This isn’t about different levels of ambition across the scenarios, but instead represents the very real headwinds that rapid deployment could face, particularly in the circumstances of Archipelagos. Trade disruption is a major outcome of the story, yet there is an important dependency on trade within the solar PV story. The minerals required, the manufacture of the panels, the grid expansion (including across borders) and even the labour required for installation all depend on good trading relationships and the free movement of people for work. For a goal of 10,000+ GW, which might include 5,000 GW of solar PV, the current global manufacturing capacity and installation capability of around 300+ GW per year would have to at least triple to around 1000 GW per year, which means adding 100 GW of new production and installation capability each and every year between now and 2030. The project pipeline for new manufacturing facilities looks robust, with the limitation on deployment in many locations being grid connectivity.
The second goal is the desire to double the average global rate of energy efficiency improvements across sectors. This is quite hard to unpick without further details, but it certainly doesn’t mean ‘doubling energy efficiency’ as reported by some media outlets. The goal could be in relation to the energy intensity of the global economy, which would be measured in energy use per unit of GDP, or on the provision of energy services, i.e. a true efficiency measure, which could be in units such as tonne-km/MJ for road freight. For this discussion I will focus on the former.
In 2022 global energy use was about 4.6 GJ per US$1000 (2016) GDP. This had improved from 5.64 GJ in 2010, meaning an improvement of some 20% or about 1.5% per year. Presumably the ambition means shifting this to 3% per annum. If this were the case then energy use would fall to around 3.7 GJ per USS$1000 by 2030. Both Sky 2050 and Archipelagos are within this range, sitting respectively 0.1 GJ either side in 2030. Apart from general societal improvements in energy efficiency, which have been ongoing for decades (9.5 GJ per US$1000 (2016) GDP back in 1960), the main driver of change in this decade will be electrification of energy services. For example, using gasoline to power a car has a well-to-wheel efficiency of about 25%, but using electricity derived from solar or wind has a turbine-(or panel)-to-wheel efficiency of around 70% or more (losses in transmission and storage of electricity combined with the efficiency of the vehicle itself). This COP28 goal is a proxy for electrification, in all its forms. That means road transport, home cooking and heating and industrial use of electricity for heat. It looks quite possible, even in the slower Archipelagos transition.
Finally there is the goal relating to hydrogen production, which seems very ambitious, but perhaps this depends on how it is interpreted. The letter calls for an overall doubling of hydrogen production, without a year being given. The Financial Times reported this as ‘Double hydrogen production to 180mn tonnes per year by 2030’. This number relates to the current global production of hydrogen which is about 90 million tonnes per year, but most of this sits within industrial processes such as the Haber process to make ammonia. The Haber process starts with natural gas, and hydrogen is an intermediate product in the production. Most global hydrogen production today comes from natural gas, releasing carbon dioxide as part of the conversion process. Some also comes from coal, with significantly increased emissions as a result.
Hydrogen is also produced as a final energy product where it is then sold for other uses, such as in a fuel cell to power a truck or within a subsequent industrial process. This is where the future lies, with final energy green hydrogen replacing fuels such as diesel in trucks, Jet A1 in planes and coal in iron ore smelting. These applications amount to a small production of final energy hydrogen today, perhaps only 100,000 tonnes per annum. So doubling this number wouldn’t be ambitious at all and is almost certainly not what the letter is calling for.
If we use the current overall global production of hydrogen and wish to double that by 2030, then the COP28 target would have the world at 180 million tonnes per year (as the Financial Times noted), which presumably means about 80 million tonnes for new final energy applications such as fuel cells in transport and iron ore smelting. This is considerably in excess of even the Sky 2050 scenario, which sees 10 million tonnes in 2030 and doesn’t reach 80 million tonnes of final energy hydrogen until 2040. In Archipelagos that date moves out to 2055.
The challenge for hydrogen may not be the ability to produce it, given that electrolyser manufacturing capacity is ramping up very quickly. 80 million tonnes per annum of green hydrogen would require some 600 GW of electrolyser capacity to produce. According to the IEA, global electrolyser manufacturing capacity reached almost 11 GW per year in 2022, and based on company announcements, the global manufacturing capacity for electrolysers could reach more than 130 GW per year by 2030. This could deliver nearly 400 GW of capacity by 2030, still short of the COP28 goal but not markedly so. It’s also possible that significant electrolyser capacity could be introduced to replace the existing steam reforming of natural gas for ammonia production and this would certainly reduce emissions; but it wouldn’t create new demand for hydrogen as required by the target.
The real issue for hydrogen as final energy (or a hydrogen carrier such as ammonia which is being looked at for ships) is creating that demand. There is almost none today. There are very few trucks that use hydrogen fuel cells – no planes, no ships and almost no industrial processes (other than those where it is an intermediate product now). In natural gas-based direct reduction ironmaking hydrogen does play a role, though this is in combination with carbon. Pure hydrogen is not currently used in ironmaking applications apart from a handful of pilot plants. The 10 million tonnes of new hydrogen final energy demand in Sky 2050 by 2030 is largely split between industry and road freight. Shipping is only just emerging in 2030 and aviation not until the 2040s.
While the hydrogen goal seems almost misplaced in its ambition or perhaps has simply been misinterpreted, the package of targets still represents an important step to achieve by the end of this decade. But what is puzzling is why the package didn’t include a specific target for carbon capture and storage given that the UAE and Dr. Sultan al-Jaber have discussed the importance of the technology on many occasions. Irrespective of the objections of some environmental groups, repeated analyses by multiple organisations (including the Shell scenarios) show that without carbon capture and storage technology the 1.5°C goal cannot be realised. We also shouldn’t forget that while CCS projects can take a few years to deliver, their scale is significant at 1+ million tonnes CO2 per year per project once operational.
A substantial but not unachievable goal for 2030 would be to see the construction of 500 large scale (> 1 million tonnes per annum CO2) CCS facilities. As of late 2022, the Global Carbon Capture and Storage Institute reported 30 facilities in operation, 11 under construction and about 150 in various stages of planning.
Note: Shell Scenarios are not predictions or expectations of what will happen, or what will probably happen. They are not expressions of Shell’s strategy, and they are not Shell’s business plan; they are one of the many inputs used by Shell to stretch thinking whilst making decisions. Read more in the Definitions and Cautionary note. Scenarios are informed by data, constructed using models and contain insights from leading experts in the relevant fields. Ultimately, for all readers, scenarios are intended as an aid to making better decisions. They stretch minds, broaden horizons and explore assumptions.
Over the last 10 days I have been travelling by ship up and down the west coast of Greenland, enjoying the spectacular sights this country has to offer and getting a taste of the long history of human settlement in the region from the excellent museums that have been established in various towns. Perhaps more than any other place I have visited, the human presence in Greenland appears to have been shaped by climate change; not the anthropogenic changes currently underway, but the natural changes that have occurred over the last 10,000 years.
The original spread of humans form Africa was some 200,000 years ago, but it wasn’t until 15,000 – 20,000 years ago that they crossed the land bridge that existed between what is now Russia and Alaska (lower sea levels) and headed south through the Americas. This was presumably because the Arctic and sub-Arctic regions of North America were still largely covered in glacial ice as the world emerged from the most recent glacial era and into the current Holocene period. As the glaciers receded and North America became what we see today, settlers moved north and eventually into Greenland, arriving there some 4,000 years ago.
From what I saw, Greenland sits on the edge of habitability, with limited areas for any form of agriculture and a hardy population who engage in hunting and fishing to maintain their livelihoods. This has been the case for 4,000 years, but with small variations in climate the population has waxed and waned, sometimes vanishing completely (the Dorset people) and at other times expanding as new settlers arrived (the Vikings) to make the most of slightly warmer periods. There are almost certainly other contributing factors to the changes, but climate appears to be an important one. Living on the edge can be perilous as small changes in conditions can mean that settlements must be abandoned rather than attempting to adapt to the change. This is a story playing out today in some parts of the world as anthropogenic climate change takes hold.
Today Greenland appears as a growing economy, with towns and villages expanding to become small cities, such as in the capital Nuuk. Below are some of the images I captured during my trip.
But there are also signs of a warming climate, such as the recognition that glaciers are visibly retreating and previously sold permafrost becoming unstable and leading to landslides. These are signs that can’t always be captured in a single image, but come from observations by locals and regular visitors over a long period of time. However, one glacier we visited showed real signs of retreat. A debris field of rocks (moraine) sat well in front of the glacier face, implying that these rocks had been deposited as the glacier retreated.
On a day at sea we had perfect weather and were fooled by a Fata Morgana mirage, which appeared to show icebergs floating in the air or appearing highly distorted relative to the actual berg (which we couldn’t see as it was over the horizon).
The energy transition is also making progress in Greenland with EVs starting to appear on the roads and recharging facilities available, at least in Nuuk, the capital.
But the transition may also impact Greenland in another way; the country has perhaps the largest available deposits of rare earth minerals outside China. Metals such as Neodymium are essential for wind turbines. How might a warming climate and a world hungry for rare earth metals impact the development of Greenland?
On the flight back to London we were treated to spectacular views of the ice cap and surrounding glaciers feeding from it.
A guest post by my scenarios team colleague Richard Baker – Senior Energy Adviser
There is widespread consensus that a marked decline in the use of all oil and gas over the coming decades is required if the world is to meet the goals of the Paris climate accord. Any discussion of technology that is perceived as prolonging investment in their usage is invariably greeted with condemnation. Recently, in the run-up to COP28 in the UAE, the incoming COP President, Sultan Ahmed Al-Jaber, was criticized in some sections of the media for stating that the world needs to focus on tackling emissions from fossil fuels rather than simply eliminating their use.1
But technologies that reduce emissions from oil and gas play a critical role in a transition to net zero and the incoming COP President was correct to address this. To understand why, Shell’s recently published Sky 2050 scenario provides a useful framework. In this scenario, net-zero emissions (NZE) is reached in 2050. Although the temperatures in the scenario rise to 1.7ºC, as modeled by MIT, negative emissions in the second half of the century result in a temperature rise of 1.2ºC above the pre-industrial average in 2100.
Sky 2050 does not make unrealistic assumptions about near-term oil and gas production or a rapid decline in demand for oil and gas. Global demand is yet to start declining and it is difficult to envisage upstream projects already operating or currently under development being paused or canceled. To that end, the Sky 2050 scenario sees demand mostly plateau this decade, but then rapidly decline in the 2030s and 2040s, with oil at 45 mb/d (million barrels per day) and natural gas at 1.9 Tcm (trillion cubic meters) by 2050, which are both slightly less than half of today’s levels. A demand led trend towards zero oil and gas by 2050 isn’t realistic as we are still far from having a complete set of technologies to replace all the uses for oil and gas.
In fact in Sky 2050 it isn’t until 2100 when the world has largely left the era of fossil fuel energy behind, although even then oil and gas are still used for making things, from solvents to plastic water bottles.
While Sky 2050 in 2050 clearly shows a reduction from today, this is nowhere near zero. Instead, Sky 2050 relies on significant use of industrial carbon capture and storage and negative emissions that use a combination of technological and natural sinks to reach net-zero emissions. The technological storage of carbon dioxide is significant by 2050 and beyond; in Sky 2050, the size of the carbon capture utilization and storage (CCUS) industry is ultimately bigger than the natural gas industry today in terms of the volumes of gas handled and direct air capture (DAC) plays an ever more prominent role in the second half of the century.
Yet moves to capture and store carbon dioxide emissions are not universally popular. Some argue that it gives the industry carte blanche to carry on producing at today’s levels. But continuing to invest in the industry, including emission reducing technologies, is not the same as maintaining or growing production.
Reservoir decline rates are hard to quantify as they are rarely left without any intervention to simply decline. Rates of 4-5% are often quoted, but this usually includes drilling additional wells or installing pumping equipment, and the true rate is probably higher. But even using a 4-5% decline rate from now would give production levels of 23-30 mb/d in 2050 for oil and 0.9-1.2 Tcm for gas, significantly below the demand levels modelled in Sky 2050.
This gap will need to be filled by ongoing investment. Objections to new projects often raise the International Energy Agency’s (IEA) landmark Net Zero study as evidence, but the report is usually misquoted. The report does not say that no investment in oil and gas is required, but instead states that “no new oil and gas fields are required beyond those that have already been approved for development” and the required investment levels reported, which average $500 billion per year this decade, are more or less what the industry is currently spending. Even in the 2030’s, the IEA calculation of required spending levels of $300 bln per year is considerable. And the context behind the IEA statement is almost never included. The scenario from which the statement emerges not only requires a huge investment in new energy systems but very importantly, a world making significant efforts to reduce overall energy demand, through important changes in behaviour (e.g. cycling more, not flying etc.), extreme efficiency measures in the built environment and even some energy austerity. Most of that isn’t happening or at best, isn’t happening fast enough or in a sustained way.
Whether the required oil and gas investment could be focused only on existing fields, or if new developments are required, is a matter of debate. A cursory glance around the world today would find no shortage of oil and gas assets with large resources that are struggling to maintain production, even when incentivized by the recent uptick in oil prices. For many countries, geopolitical and local factors are restricting investment, and in some cases the technical expertise previously provided by international oil companies is lacking.
So how is the industry responding? There are two pathways playing out.
The first is that existing fields are attracting investment to maintain production, but there is also some new field development underway. The IEA report also goes on to say that ‘minimizing emissions from core oil and gas operations should be a first-order priority for all oil and gas companies’. Many operators are doing just that, seeking ways to reduce their own production emissions, including the electrification of facilities (and generating that electricity from renewable sources) and aiming to eliminate flaring, amongst others. And there is widespread effort underway to clamp down on fugitive methane emissions with techniques such as drone technology, but particularly from aging infrastructure where such initiatives are helping to identify the worst culprits. The counter argument is that for oil, where 85-90% of most emissions come at the point of combustion in a car, plane, or ship’s engine, reducing intensity in the upstream has a relatively small impact on reducing total emissions. But given that Sky 2050 sees 250 Gt of CO2e emissions from oil use in the next 27 years, addressing 10-15% of the issue still adds up to 25-40 Gt, equivalent to global emissions from a single year.
The second pathway is the focus on developing carbon capture and storage for the so-called Scope 3 emissions, or the emissions from the actual use of oil and gas. Many such projects are in the pipeline but there is also real innovation emerging. For instance, Occidental plan to inject CO2 captured directly from the air into reservoirs in a technique known as Enhanced Oil Recovery. The company claims that more CO2 is injected than is subsequently released when the fuel is combusted, and regulators agree; oil produced via this method will qualify for the low-carbon (45Q) tax credit. For now, it’s the only project under development, but if successful, it may provide a blueprint for others to follow. For gas, where combustion tends to be more concentrated in a power plant or industrial unit, there is significant scope for point source capture and there are many projects in development, although not yet on a par with the scale in Sky 2050.
It’s often said that CCUS is an unproven technology when, in fact, the capture and re-injection of CO2 have both been practiced for decades. According to the IEA, of the 40 Mt captured in 2021, around 75% was captured from oil and gas operations. The question is whether commercial drivers, including carbon taxes, can help deliver the scale envisaged in Sky 2050. The issue with carbon capture and storage has never been the technology, but always the business model to support the investment.
While in Sky 2050 there will be reduced demand for oil and gas in sectors that can be electrified, like transport, by mid-century there will still be sectors of the economy that are using oil and gas because the alternatives are not deploying at sufficient scale. The demand from these sectors is greater than natural decline alone would allow, requiring further oil and gas investment.
Dr Al-Jaber was right to point out that the production that remains will need to be as low carbon as achievable, while a global negative emissions industry needs to be built. These two parts of a burgeoning carbon management industry will require continuous investment as well as policy support. The challenge for the upstream oil and gas sector is to deliver both and that could even mean a combined production and carbon capture sector that is bigger in the second half of the century than the stand-alone oil and gas production sector today.
Note: Shell Scenarios are not predictions or expectations of what will happen, or what will probably happen. They are not expressions of Shell’s strategy, and they are not Shell’s business plan; they are one of the many inputs used by Shell to stretch thinking whilst making decisions. Read more in the Definitions and Cautionary note. Scenarios are informed by data, constructed using models and contain insights from leading experts in the relevant fields. Ultimately, for all readers, scenarios are intended as an aid to making better decisions. They stretch minds, broaden horizons and explore assumptions.